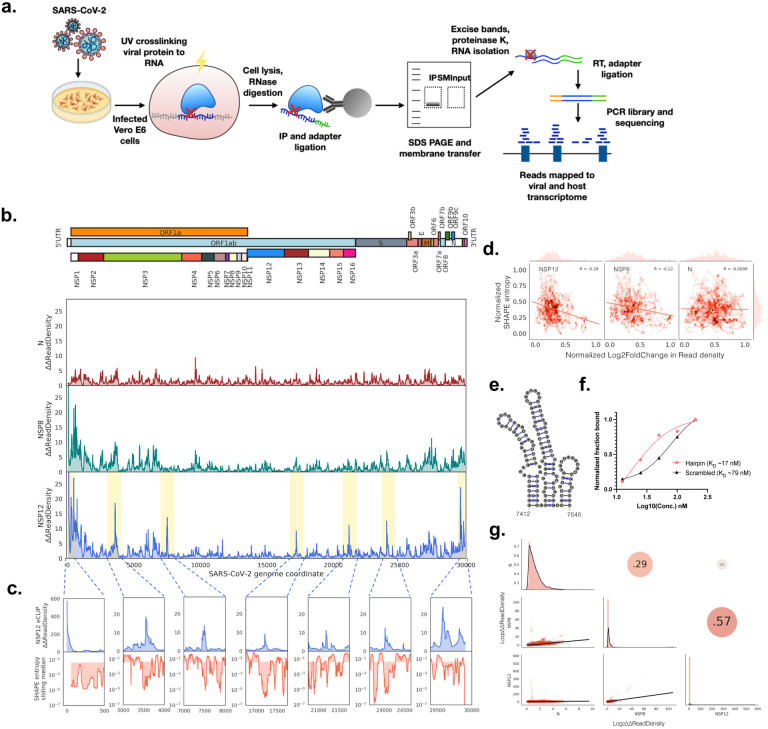
Figure 1. Genome maps of SARS-CoV-2 protein interactions with viral RNA.
a) Schematic showing eCLIP performed on SARS-CoV-2 proteins in virus infected Vero E6 cells. Proteins in infected cells are UV crosslinked to bound transcripts, which are immunoprecipitated (IP) with antibodies that recognize NSP8 (primase), NSP12 (RNA dependent RNA polymerase, RdRp) and N (nucleocapsid) proteins. Protein-RNA IP product and Input lysate are resolved by SDS-PAGE and membrane transferred, followed by band excision at the estimated protein size to 75kDa above in both IP and Input lanes. Excised bands are subsequently purified, and library barcoded for Illumina sequencing.
b) Mean fold change of eCLIP read density mapped to the positive sense SARS-CoV-2 genome in immunoprecipitated (IP) compared to input samples. Mean is taken from n = 2 independent biological samples.
c) NSP12 eCLIP zoomed into yellow highlighted regions in b. Top row, NSP12 eCLIP; bottom row, SHAPE Shannon entropy16 with a sliding median of 55 nt. Shaded region in bottom row is partitioned at the global median entropy.
d) Correlation between normalized SHAPE entropy16 and normalized log2(Fold Change) of IP over INPUT eCLIP read density i.e. eCLIP enrichment for NSP12 (left), NSP8 (middle) and N (right). R, Pearson’s coefficient.
e) Secondary structure16 of the NSP12 eCLIP peak region from position 7412–7545.
f) Fraction of RNA bound to NSP12 from filter binding assay, using hairpin RNA from position 7414–7555 and scrambled RNA as negative control.
g) Correlation matrix of mean fold change of eCLIP read density: Bottom left panels, 2D density plots; diagonal, density plot corresponding to samples in bottom labels; top right panels, Pearson’s coefficient between samples.

