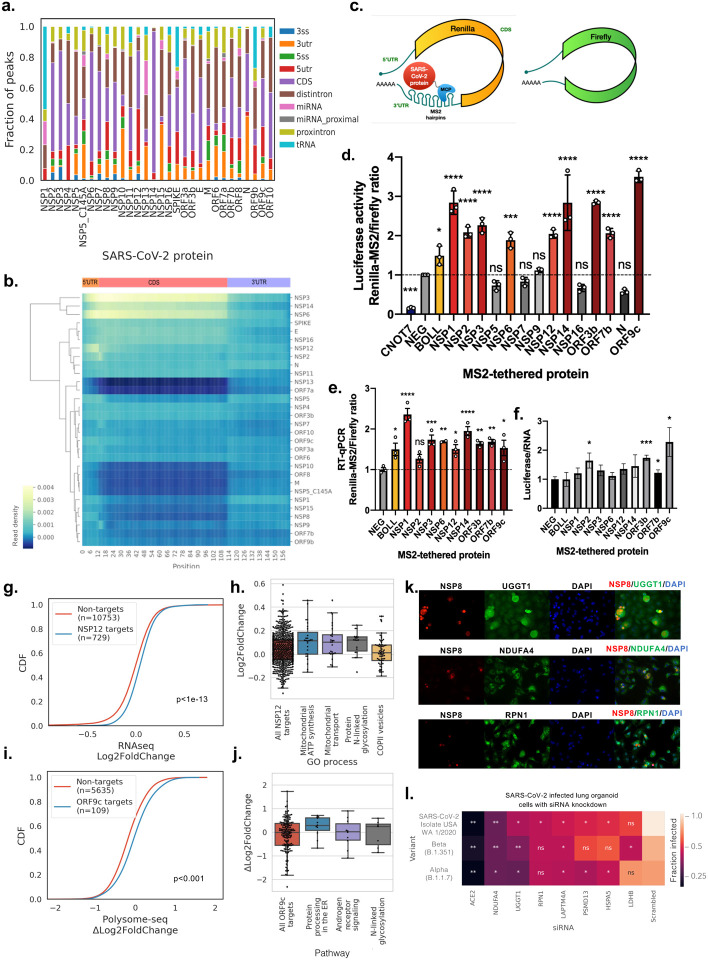
Figure 4. SARS-CoV-2 proteins specifically upregulate target gene expression.
a) Stacked bar plot showing fraction of reproducible peaks (by IDR14) mapping to different regions of coding genes. 3ss, 3′ splice site; 3utr, 3′ untranslated region (UTR), 5ss, 5′ splice site; 5utr, 5′ UTR; CDS, coding sequence.
b) Clustermap showing read density of target RNA by each SARS-CoV-2 protein scaled to a metagene profile containing 5′ UTR, CDS and 3′ UTR regions.
c) Schematic showing the Renilla-MS2 and Firefly dual luciferase reporter constructs, where individual SARS-CoV-2 proteins fused to MCP are recruited to the Renillia-MS2 mRNA.
d & e) Bar plot showing luciferase reporter activity ratios (d) and reporter RT-qPCR ratios (e) for the indicated coexpressed SARS-CoV-2 protein, known human regulators of RNA stability (CNOT7, BOLL) and negative control (FLAG peptide). Ratios are normalized to the negative control (mean ± s.e.m., n = 3 biologically independent replicate transfections; * p<0.05, ** p<0.005, *** p<0.0005, **** p<0.0001, two-tailed multiple t-test; ns, not significant).
f) Bar plot showing the fold change of luciferase activity ratio and RT-qPCR ratio (mean ± s.e.m, n = 3; * p<0.05, *** p<0.001, two-tailed Welch’s t-test).
g) Cumulative distributive plot (CDF) of log2(Fold Change) of gene expression in HEK293T cells transfected with a plasmid overexpressing NSP12 versus an empty vector plasmid. KS test p values indicate significance of difference in differential expression of NSP12 target genes versus non-eCLIP target genes.
h) Enriched Gene Ontology (GO) processes (adjusted p < 10–4) of NSP12 target genes, with box plots indicating quartiles of differential expression (log2(Fold Change)) of target genes (black dots).
i) CDF plot of Δlog2(Fold Change) of polysomal mRNA levels in BEAS-2B cells nucleofected with a plasmid overexpressing ORF9c versus an empty vector plasmid. KS test p values indicate significance of difference in differential expression of ORF9c target genes versus non-eCLIP target genes.
j) Enriched BioPlanet pathways (adjusted p < 0.01) of ORF9c target genes, with box plots indicating quartiles of differential expression (Δlog2(Fold Change) of polysomal mRNA levels) of target genes (black dots).
k) Immunofluorescence images (40X) of SARS-CoV-2 infected A549-ACE2 cells stained for SARS-CoV-2 NSP8 (red), endogenous genes (green), DNA content (blue).
l) Heat map showing infection rate as measured by the integrated intensity of immunofluorescence staining of SARS-CoV-2 nucleocapsid protein in human iPSC derived lung organoid cells. Cells are treated with siRNAs targeting different host genes prior to viral infection by three different variants of SARS-CoV-2. Significant differences in infection rates are given by two-tailed t-test, * p<0.05, **p<0.01, ns, not significant, as compared to scrambled siRNA control for n = 3 biologically independent samples.

