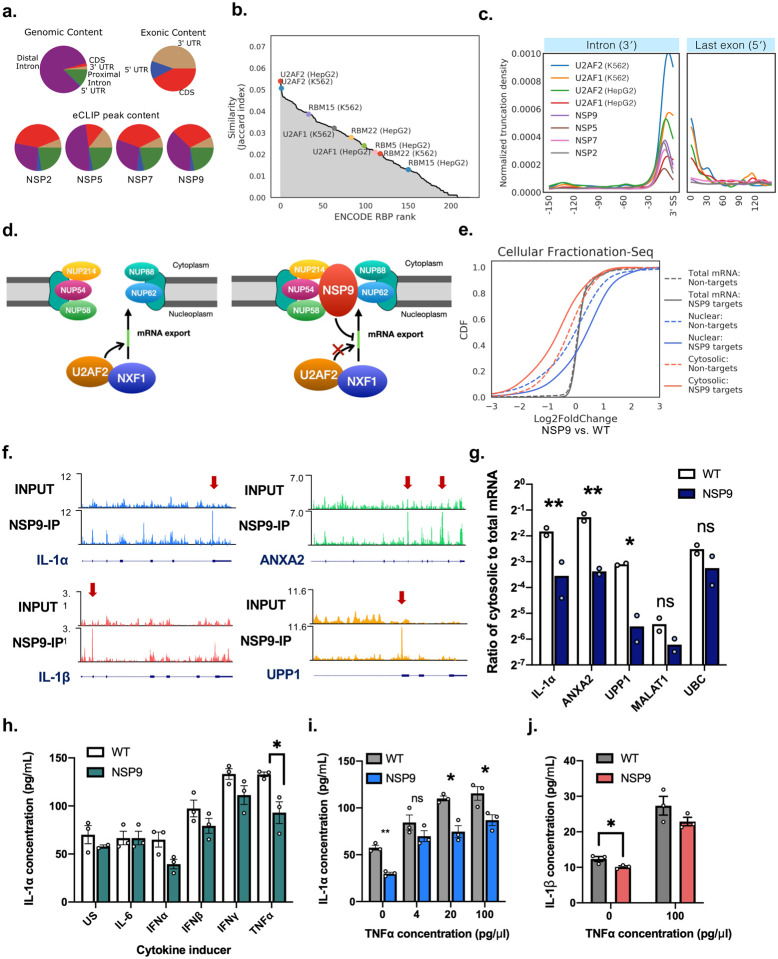
Figure 5. NSP9 interacts with U2AF2 substrates and inhibits mRNA export.
a) Pie charts showing distribution of eCLIP peaks across different coding RNA regions for NSP2, NSP5, NSP7 and NSP9. Genomic content and exonic content are based on the hg19 human reference genome.
b) Jaccard index similarity of NSP9 target genes as compared with all 223 ENCODE RBP datasets.
c) Metadensity of eCLIP reads truncation sites averaged across all RNA targets by SARS-CoV-2 NSP2, NSP5, NSP7 and NSP9, and U2AF1/2 from the ENCODE consortium, zoomed into the region 150 nt upstream of 3′ splice sites, and the region 150 nt downstream of the 5′ end of the last exon.
d) Schematic illustrating a model of NSP9 interacting with nuclear pore complex proteins NUP62, NUP214, NUP58, NUP88 and NUP54, and inhibiting U2AF2 substrate recognition in preventing NXF1 facilitated transport.
e) Cumulative distributive plot (CDF) of log2(Fold Change) of BEAS-2B cells overexpressing NSP9 versus wildtype BEAS-2B cells in each of nuclear, cytosolic, and total mRNA fractions. Solid line indicate NSP9 target genes, dashed lines indicate genes that are not NSP9 targets.
f) Genome browser tracks of NSP9 eCLIP target RNA mapped to IL-1α, IL-1β, ANXA2 and UPP1. g) Bar plot showing ratios of cytosolic to total fraction of mRNA levels measured by RT-qPCR, in wild type (WT) BEAS-2B cells, and BEAS-2B cells transduced to express NSP9 (*p<0.05, **p<0.0005, two-tailed multiple t-test with pooled variance, n = 2 biologically independent replicates).
h) Bar plot showing mean concentration of IL-1α in culture media from WT and NSP9 expressing BEAS-2B cells, 48h after induction by cytokines indicated on the x-axis (US, unstimulated; mean ± s.e.m, n = 3 biologically independent replicates; *p < 0.05, Tukey’s multiple comparisons test).
i) Bar plot showing mean concentration of IL-1α in culture media from WT and NSP9 expressing BEAS-2B cells, 48h after induction by different levels of TNFα (mean ± s.e.m, n = 3 biologically independent replicates, *p<0.05, **p<0.005, two-tailed t-test).
j) Bar plot showing mean concentration of IL-1β in culture media from WT and NSP9 expressing BEAS-2B cells, 48h after induction by 0 or 100 ng/ml TNFα (mean ± s.e.m, n = 3 biologically independent replicates, *p<0.05, **p<0.005, two-tailed t-test).

