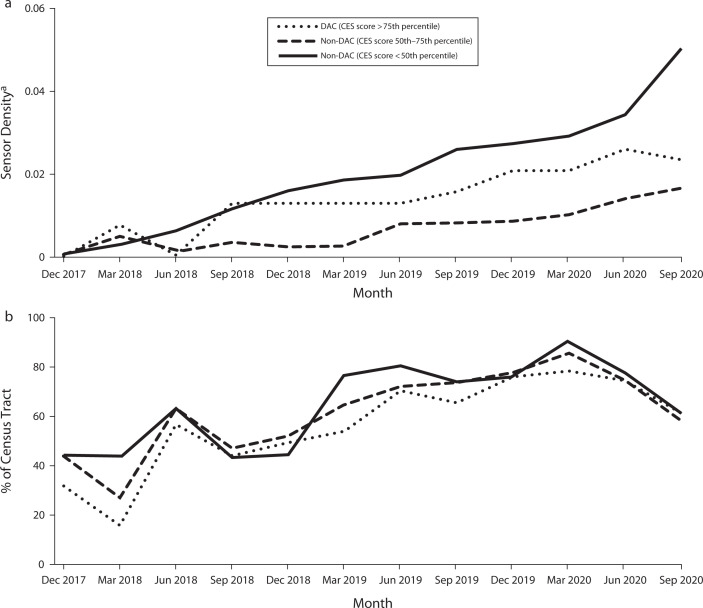
FIGURE 1—
PurpleAir Sensor Network (a) Sensor Density and (b) Operational Status: California, 2017–2020
Note. CES = CalEnviroScreen 4.0 version; DAC = disadvantaged communities; PM2.5 = particulate matter with a diameter smaller than 2.5 µm.
aDefined as the number of sensors per census tract divided by census tract population density.

