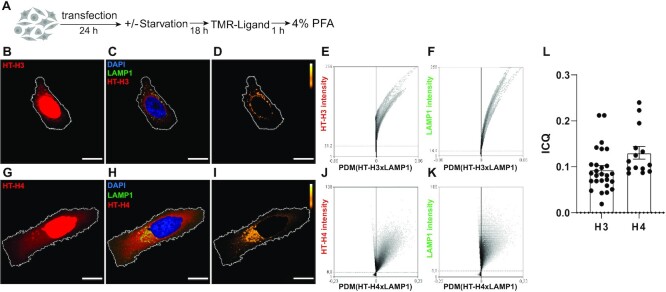
Figure 2.
Newly synthesized histones H3 and H4 are targeted to lysosomes. (A) Scheme illustrating the experimental approach to evaluate the targeting of histones H3 and H4 to the lysosomal compartment by microscopy imaging. (B, C, D, G, H, I) Representative confocal microscopy images of HeLa cells expressing HaloTag-H3 (HT-H3) (B–D) and HaloTag-H4 (HT-H4) (G–I) and stained with HaloTag-TMR ligand (red), DAPI (blue) and immunostained against LAMP1 (green). (B, G) Images of HaloTag-TMR staining showing the distribution of HT-H3 (B) and HT-H4 (G) (red) in cells. (C, H) merge images of HaloTag-TMR staining (red), DAPI (blue) and LAMP1 (green) for H3 (C) and H4 (H). (D, I) Pseudocolored images showing the pixels that colocalize (yellow/white) or show exclusion (black) for the staining between HaloTag-TMR and LAMP1 in HeLa cells, according to ICA analysis, for H3 (D) and H4 (I). The area of nuclei corresponding to DAPI staining was subtracted from images of HaloTag-TMR (red) and LAMP1 (green) channels and for colocalization analysis. Scale bar = 10 μm. (E, F, J, K) Representative ICA graphs obtained from the intensity correlation analysis of cells expressing HT-H3 (E, F) and HT-H4 (J, K), and immunostained with LAMP1 24 h post-transfection, where the Y-axis corresponds to a scale for 8-bit images ranging from 0 to 256, and the X-axis corresponds the covariance of the mean intensity (PDM = product of the differences from the mean). (L) Intensity Correlation Quotient (ICQ) graph, as HT/LAMP1 signal of 27 (HT-H3) and 14 (HT-H4) cells for condition.

