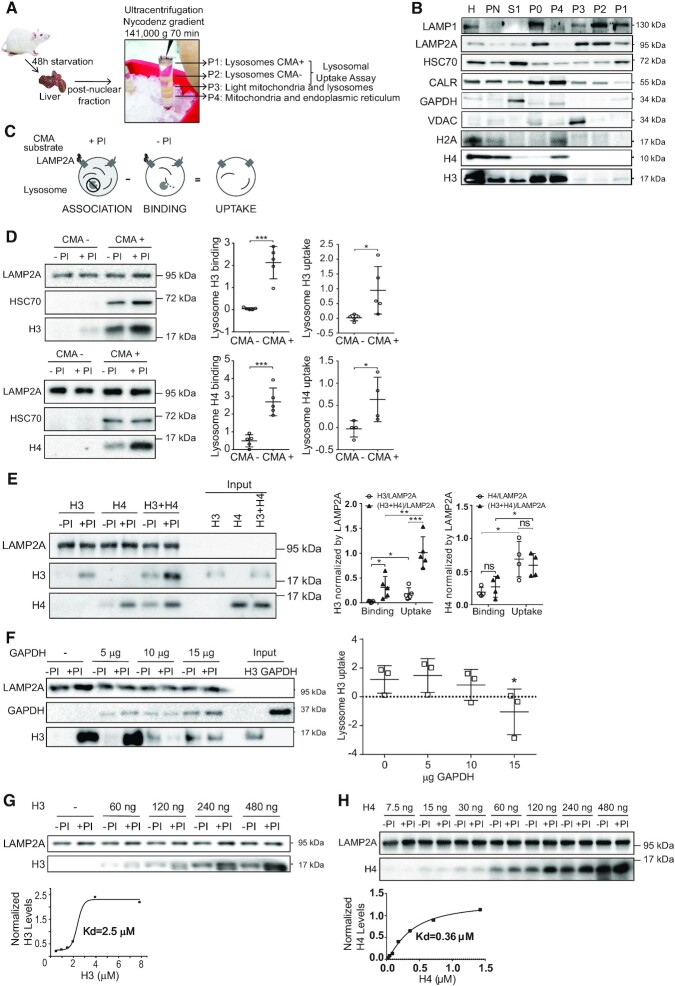
Figure 3.
Histones H3 and H4 are degraded by CMA in vitro. (A) Scheme of lysosome extraction from the rat liver. (B) Immunoblot analyses loading 30 μg of the different fractions collected, H: liver homogenate, PN: post-nuclear fraction, S1: supernatant of PN, P0: input of the endoplasmic reticulum, mitochondria and lysosomal fractions, P1: lysosomes enrichment in the CMA activity (CMA+), P2: lysosomes mix of CMA+ lysosomes and those with low CMA activity (CMA–), P3: lysosomes and light mitochondria, and P4: mitochondria and endoplasmic reticulum. (C) Experimental scheme to investigate lysosomal association, binding and uptake of target substrates, in the presence (+) or absence (−) of protease inhibitors (PI). (D) Left, representative immunoblot of the uptake assay using 60 μg of lysosomes CMA– and CMA+ fractions with histones H3 (top) and H4 (bottom). Right, graphs of binding and uptake, quantifying the signal of histone H3 (top) and H4 (bottom) normalized by the LAMP2A signal from five independent experiments: ***P < 0.001, *P< 0.05, Student′s t-test. (E) Left, immunoblot of the uptake assay, comparing binding and association of 60 ng of recombinant histone H3, 60 ng of recombinant histone H4, or 60 ng of recombinant histone H3 and 60 ng of H4. For uptake assays with both substrates, aliquots of recombinant H3 and H4 were mixed at 4°C and immediately added to lysosomes. Input represents 10% of the reaction. Right, graphs of binding and uptake, quantifying the signal of histone H3 and H4 normalized by the LAMP2A signal from five (histone H3) and four (histone H4) independent experiments: ***P < 0.0001, **P < 0.001, *P< 0.005, Student′s t-test. (F) Left, representative immunoblot of the uptake assay of 60 ng of histone H3, upon increasing amounts of recombinant GAPDH. Input represents 10% of the reaction. Right, graph of the uptake assay, quantifying the signal of histone H3 and GAPDH normalized by the LAMP2A signal from three independent experiments: *P < 0.05, Student's t-test. (G, H) Top, representative immunoblot of the uptake assay with increasing concentrations of recombinant histone H3 (G) or histone H4 (H). Bottom, saturation curve obtained from the quantification of the histone H3 (G) or histone H4 (H) signal from the western blot in the absence of protease inhibitors (–PI, binding) normalized against the LAMP2A signal, as explained in detail in Materials and Methods.

