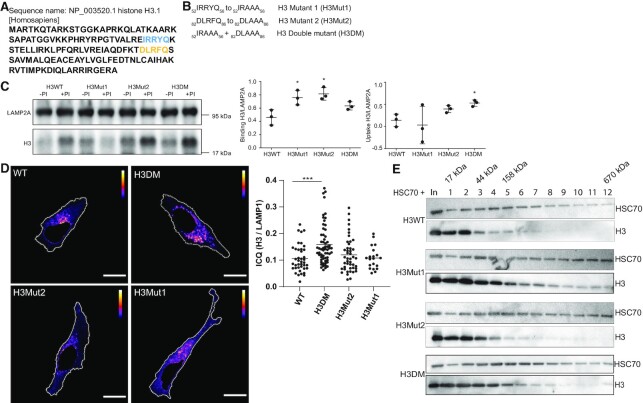
Figure 4.
The KFERQ motifs on histone H3 play a negative role on the targeting to CMA. (A) Analysis of KFERQ sequences using KFERQ finder software (28) identify two motifs in H3.1 protein, a canonical 82DLRFQ86 motif (yellow) and a putative 52IRRYQ56 motif (blue). (B) Mutants of the histone H3 KFERQ motifs. (C) Left, representative immunoblot of the uptake assay using histone H3WT, H3Mut1, H3Mut2 and H3DM. Right, graphs of binding and uptake, quantifying the signal of histone H3 normalized by the LAMP2A signal from three independent experiments: *P< 0.05, Student′s t-test. (D) Left, representative pseudocolored images of HeLa cells expressing HaloTag-H3WT, HaloTag-H3Mut1, HaloTag-H3Mut2 and HaloTag-H3DM, showing the pixels that colocalize (yellow) or show exclusion (blue) for the staining between HaloTag-TMR and LAMP1 in HeLa cells, according to ICA analysis. The area of nuclei corresponding to DAPI staining was subtracted from images of HaloTag-TMR (red) and LAMP1 (green) channels and for colocalization analysis. Right, Intensity Correlation Quotient (ICQ) graph, as HT/LAMP1 signal for each of the mutants. Scale bar = 10 μm. (E) Interaction analysis between recombinant histone H3 and HSC70. Ten μg (600 pmol) of either recombinant H3WT, H3Mut1, H3Mut2 or H3DM were mixed with 40 μg (600 pmol) of recombinant HSC70 and resolved by a 5–20% glycerol gradient. Immunoblot of fractions derived from the gradient were analyzed as shown. Fraction number 1 corresponds to the lightest fraction collected. In: input, it represents 1% of the sample.

