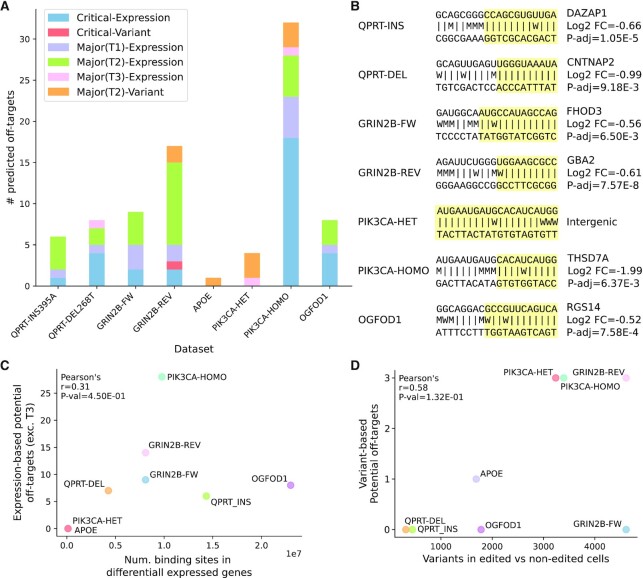
Figure 4.
Predicted Cas9 off-target criticalities discovered in test datasets. (A) Number of predicted off-targets identified in each dataset split by degree of severity (critical or major) and by discovery method (variant or expression-based screening). Major predicted off-targets related to the expression-based screening are divided in type 1 (T1), type 2 (T2) and type 3 (T3). All major predicted off-targets related to variants are of type 2. (B) For each dataset the most favourable (lowest ΔGB) predicted off-target is reported (preference is given to the critical ones with canonical NGG PAM and not overlapping repeat-masked regions). The gRNA-DNA binding pattern is represented with the following symbols: |, canonical base pair; W, wobble base pair; M, mismatch. The portion of the gRNA-DNA interaction with lowest resulting binding energy ΔGB is highlighted in yellow, i.e. the region comprising the segment of the DNA target involved in the most energetically favourable binding interaction with the gRNA. Information on the associated downregulated gene(s) is provided (right). Log2 FC, log2 fold change; P-adj, Benjamini-Hochberg adjusted Wald test P-value. (C) Correlation between the number of Cas9 binding sites in the differentially expressed genes and the number of potential off-targets discovered by the expression-based CRISPRroots analysis. Major type 3 off-targets are excluded because they overlap non-expressed genes or intergenic regions. (D) Correlation between the number of short variants discovered from the RNA-seq in Cas9-edited vs controls cells and the number of variant-based potential off-targets.

