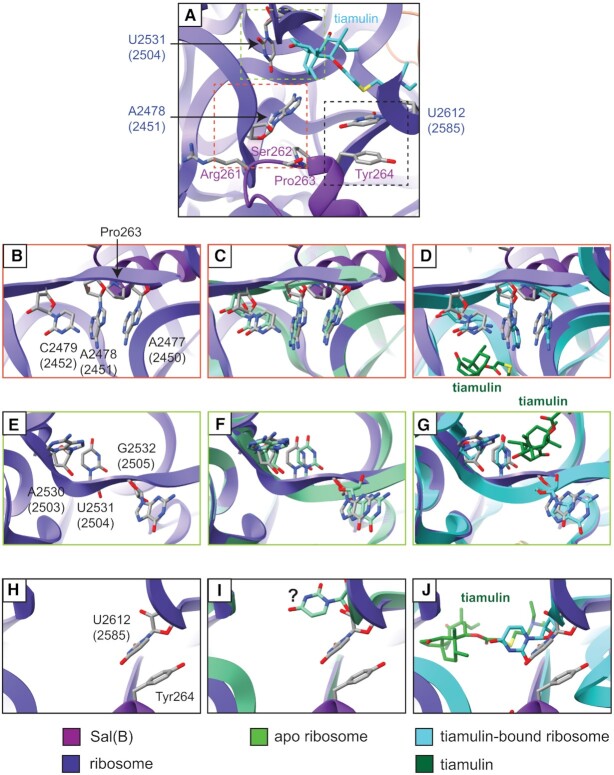
Figure 6.
Changes in PTC conformation on binding of Sal(B) or tiamulin to the ribosome. (A) Atomic model of the Sal(B)•ribosome complex, zoomed-in on the interdomain linker loop of Sal(B) and ribosome PTC. Sal(B) is shown in purple and 23S rRNA in indigo, with selected residues shown as atomic models. The atomic model of tiamulin from PDB 1XBP is superimposed (light blue) after alignment of the 23S rRNA chains of PDB 1XBP and the Sal(B)•ribosome complex model. No region of the Sal(B) interdomain linker reaches sufficiently close to the drug-binding site to mediate direct displacement of a bound PLM molecule. Dashed coloured boxes outline the regions shown in detail in (B)-(J). (B, E, H) Selected regions of the 23S rRNA from the Sal(B)•ribosome complex model. (C, F, I) The same regions with a model of the apo S. aureus ribosome superimposed. The apo S. aureus model was made by refining the relevant 23S rRNA regions from the Sal(B)•ribosome complex model into map EMD-10076. The question mark in part (I) highlights that residue U2612 (2585) of the apo ribosome has poor density and so is likely conformationally flexible. (D, G, J) The same regions with a model of the ribosome from D. radiodurans in complex with tiamulin superimposed, PDB 1XBP (23S rRNA light blue, tiamulin dark green). For 23S rRNA nucleotides, E. coli numbering is shown in parentheses.

