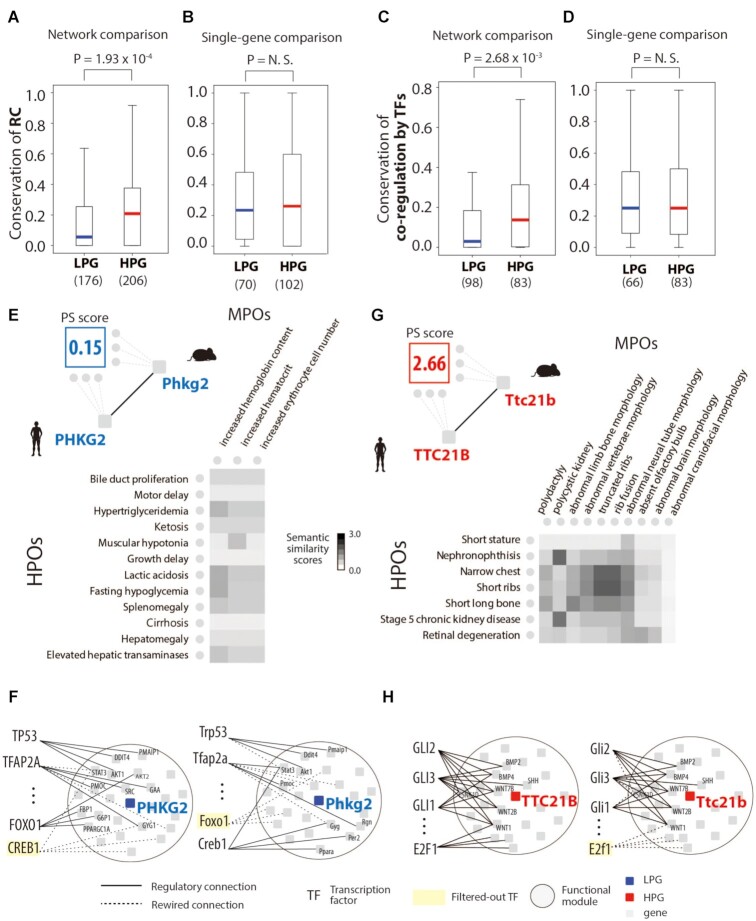
Figure 2.
Regulatory network conservation and phenotypic similarity. (A) The conservation of regulatory networks in low phenotype similarity genes (LPGs) and high phenotype similarity genes (HPGs). (B) The conservation of the regulation of a single gene in LPGs and HPGs. (C) The conservation of transcription factor (TF) co-regulation of networks in LPGs and HPGs. (D) The conservation of TF co-regulation of single genes in LPGs and HPGs. The number of LPGs and HPGs used in each test is written under the x-axis. An LPG, phosphorylase kinase catalytic subunit gamma 2 (PHKG2), was used to illustrate (E) the phenotypic similarity matrix and (F) regulatory network conservation, and an HPG, tetratricopeptide repeat domain 21B (TTC21B), was used to illustrate (G) the phenotypic similarity matrix and (H) regulatory network conservation. Filtered-out TF indicates a TF that was filtered out during the enrichment test because of its regulatory links to the functional module.

