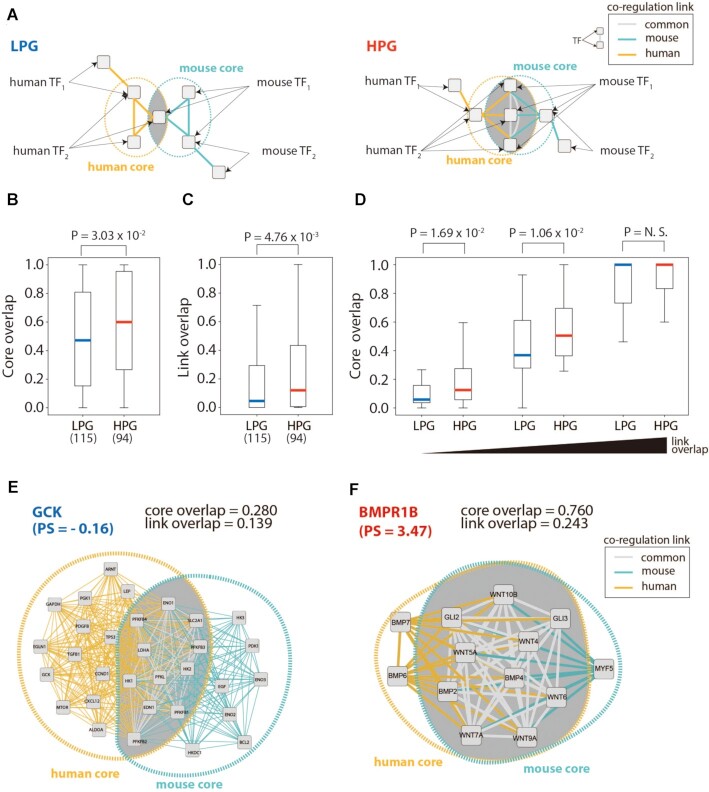
Figure 3.
The structure of co-regulation and phenotypic differences. (A) LPGs have lower overlap of co-regulation networks between humans and mice compared with HPGs. (B and C) Core overlap and link overlap of co-regulatory networks in low phenotype similarity genes (LPGs) and high phenotype similarity genes (HPGs). (D) Comparison of core overlap between HPGs and LPGs along with link overlap. (E and F) Examples of co-regulatory networks in LPGs (Glucokinase, GCK) and in HPGs (Bone Morphogenetic Protein Receptor Type 1B, BMPR1B).

