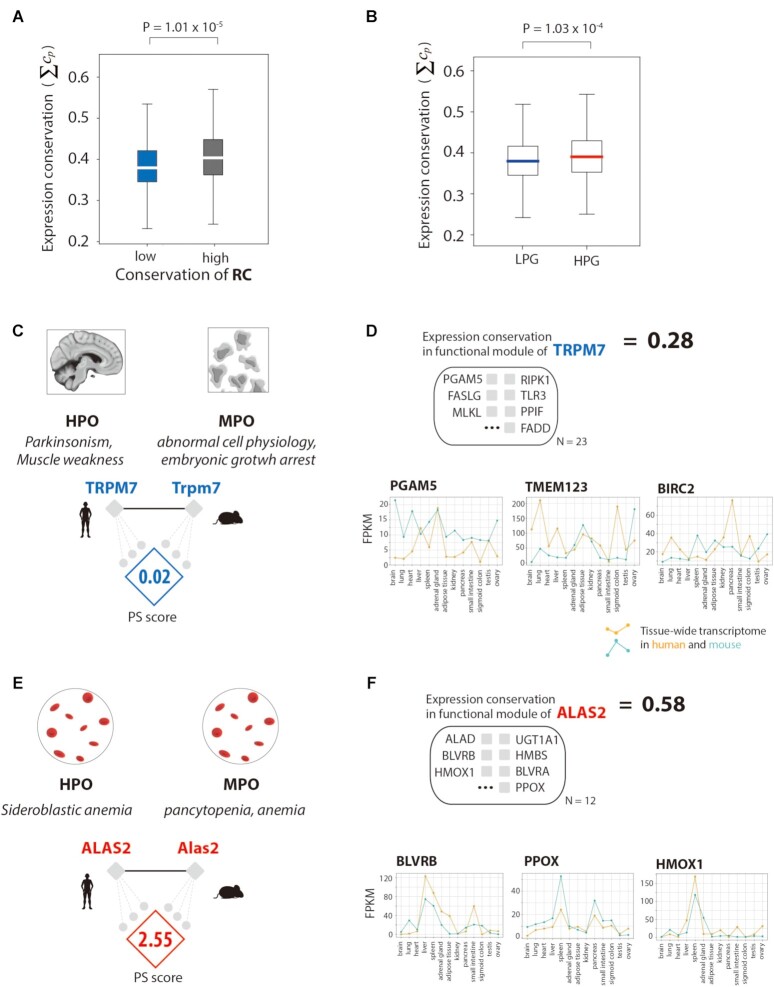
Figure 5.
Transcriptomic validation of regulatory network rewiring and phenotypic differences. (A) Comparison of the conservation of gene expression in regulatory networks with low and high conservation of regulatory connections (RCs). (B) The conservation of gene expression in regulatory networks of low phenotype similarity genes (LPGs) and high phenotype similarity genes (HPGs). (C) The PS score and gene set in functional modules of the regulatory networks of TRPM7, an LPG. (D) The conservation of gene expression in the regulatory network of ALAS2, with a conservation score of all genes in the functional module of the regulatory network. Examples of genes representing tissue transcriptomes in humans and mice. (E) The PS score and gene set in the functional modules of the regulatory networks of ALAS2, an HPG. (F) The conservation of gene expression in the regulatory network of ALAS2, with a conservation score of all genes in the functional module of the regulatory network. Examples of genes representing tissue transcriptomes in humans and mice.

