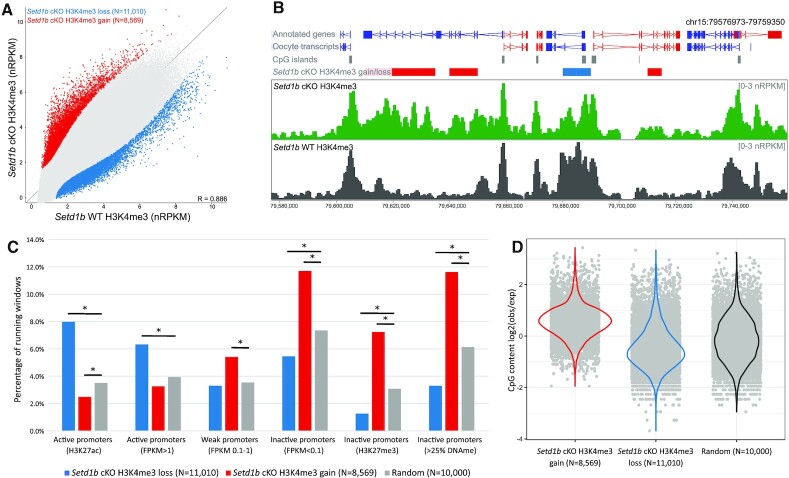
Figure 1.
(A) The scatterplot shows average normalized enrichment for H3K4me3 for 5 kb running windows (N = 544 879) between Setd1b cKO (N = 3) and WT (N = 3) d21 GV oocytes. Differentially enriched windows were identified using LIMMA statistic (P < 0.05, corrected for multiple comparisons), and those that show a loss in Setd1b cKO are shown in blue and a gain in red. (B) The screenshot shows the normalized enrichment for H3K4me3 for 1 kb running windows with a 500 bp step in Setd1b cKO and WT GV oocytes. Significant differentially enriched 5 kb windows are shown in the Setd1b cKO H3K4me3 gain/loss track, with red and blue bars showing windows that gain and lose H3K4me3 in Setd1b cKO, respectively. (C) The barplot shows the overlap between sets of promoters and differentially enriched windows that gain or lose H3K4me3 in the Setd1b cKO compared to a random set of 5 kb running windows. Pairwise Chi-Square statistic was used to compare each set of enriched windows to random. The asterisk shows those comparisons that were significant after Bonferroni correction for multiple comparisons (P < 0.008). (D) The beanplot shows the enrichment for CpG content among the 5 kb running windows that gain or lose H3K4me3 in Setd1b cKO oocytes compared to a random set of 5 kb windows.

