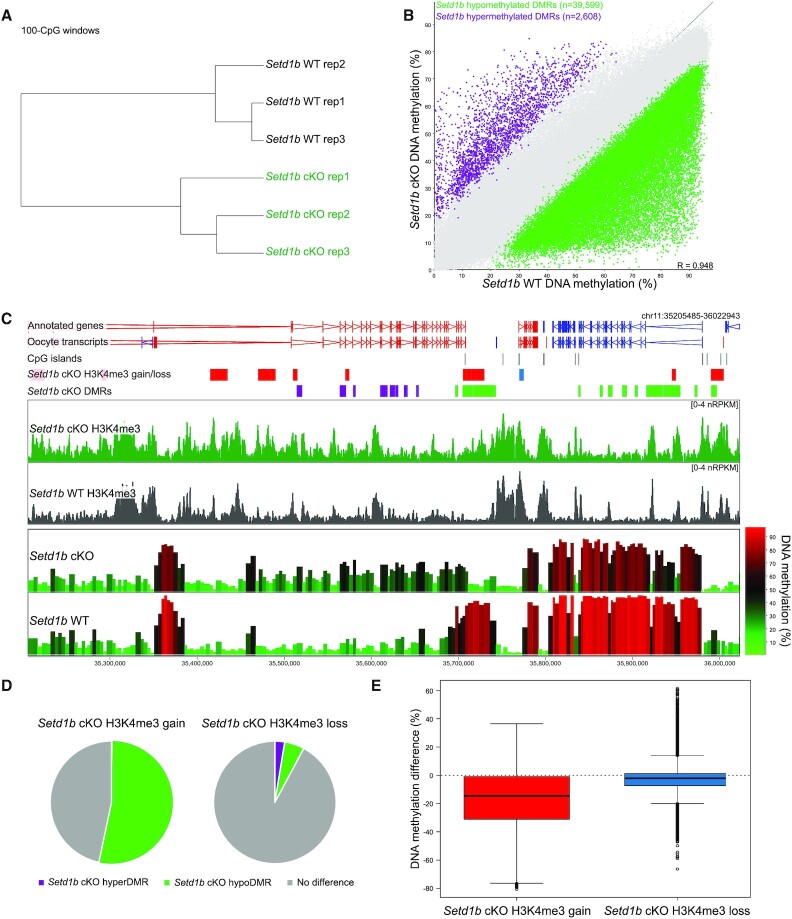
Figure 4.
(A) Hierarchical cluster shows biological replicates for Setd1b cKO (N = 3) and WT (N = 3) GV oocyte DNA methylation patterns, quantitated as 100-CpG windows, with at least 10 informative CpGs (see Materials and Methods). (B) The scatterplot shows the DNA methylation in Setd1b cKO and WT GV oocytes across 100-CpG windows, with at least 10 informative CpGs in each replicate (N = 424 105). Differentially methylated regions (DMRs) were identified using logistic regression (P < 0.05 corrected for multiple comparisons) and a >20% difference in methylation. (C) The screenshot shows H3K4me3 enrichment of 1 kb running windows with a 500 bp step, and DNA methylation of 100-CpG windows with at least 10 informative CpGs per replicate, for Setd1b cKO and WT oocytes. Regions that gain or lose H3K4me3 in Setd1b cKO are shown in the labeled annotation tracks as red and blue bars, respectively. Regions that gain or lose DNA methylation (Setd1b cKO DMRs) are shown in the labeled annotation tracks as purple and green bars, respectively. (D) The pie charts show the overlap between 5kb windows that gain (left) and lose (right) H3K4me3 in the Setd1b cKO with 100-CpG windows that are hypermethylated (HyperDMR) or hypomethylated (HypoDMR) in the Setd1b cKO (Chi-Square statistic, P < 0.0001). (E) The boxplot shows the average difference in DNA methylation (Setd1b cKO – WT) of 100-CpG windows that overlap regions that gain and lose H3K4me3 in the Setd1b cKO (t-test, P < 0.0001).

