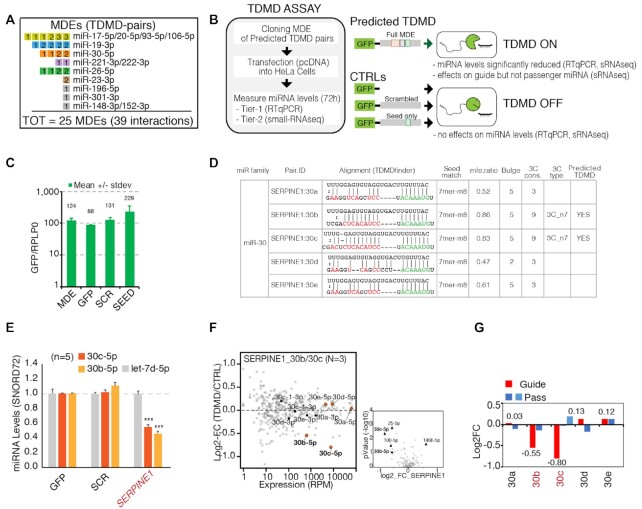
Figure 3.
Strategy for the validation of predicted TDMD pairs: the TDMD-Assay. (A) List of the predicted TDMD pairs that were experimentally validated. Each miRNA degradation element (MDE) is represented by a single square. MDEs that target the same miRNA family are grouped together. Inscribed in each square is the total number of interactions. Colored squared indicate that at least one of the corresponding TDMD interactions has been successfully validated. (B) Schematics of the TDMD-assay. For each candidate transcript, a region (∼100 bp or ∼400 bp long, depending on the construct) containing the predicted MDE was cloned into a GFP vector and transiently over-expressed in HeLa cells. (C) Expression levels of the different constructs are reported as ratios to the housekeeping gene RPLP0 expression level. (D) TDMDfinder predictions for SERPINE1 transcript and miR-30 family. Alignment and features are reported as in the online tool. (E–G) TDMD assays performed on SERPINE1 MDE. (E) Results by RT-qPCR. Mature miRNAs levels are shown as mean values with s.e.m. calculated on different biological replicates (indicated as N), normalized over CTRL_GFP. An unrelated miRNA, Let-7d, was also measured. SNORD72 was used as housekeeping gene. (n.a., not assayed). P-values were calculated by Dunnet's t-Test, using the SCR/SEED group as reference. (F) Results by small RNA sequencing (sRNA-seq). On the left, the scatter plot shows the fold changes (MDE vs CTRL, y axis) over the expression levels (reads per million, x-axis) of all the detected miRNAs. N, number of replicates. The members of the targeted miR-family (guide and passenger miRNAs) are highlighted and colored. On the right, the volcano plot highlights those miRNAs that are regulated in a statistically significant manner (P-values by Student's t-test <0.05 and log2FC >|0.5|). SERPINE1:30b is also highlighted, as it was predicted by TDMDfinder, close to significance in the sRNA-seq (P-value = 0.08) and validated by RT-qPCR in independent samples (see E). (G) Mature miRNAs levels for each individual member of the miR-30 family (with guide and passenger miRs) as measured by sRNA-seq (N, number of replicates).

