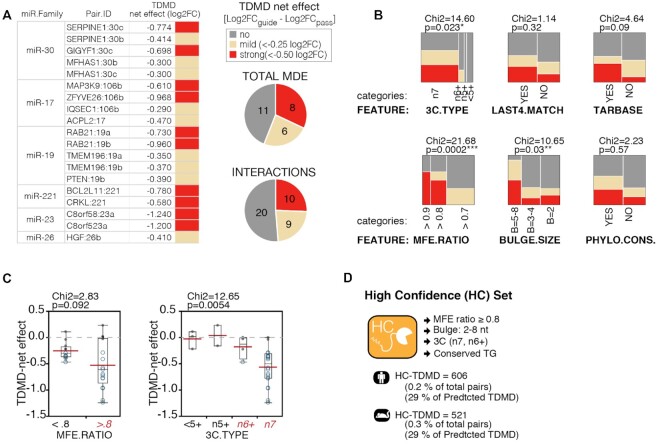
Figure 5.
Features associated to experimentally validated TDMD. (A) The table and pie charts summarize validation results by sRNA-seq. reported is the ‘TDMD net effect’, normalizing the log2 fold change (MDE versus CTRL) of the guide strand over the corresponding effect on the passenger strand. (B) Contingency analysis, correlating the different ‘TDMD net effect’ classes with the main features related to TDMD predictions. P-values by Chi-test. (C) Box plots of the TDMD net effects, with TDMD pairs grouped according to their MFE ratio (left) or 3C-type (right). P-values and Chi-square by Wilcoxon test. (D) List of the criteria used in classifying human and mouse TDMD pairs as High-Confidence.

