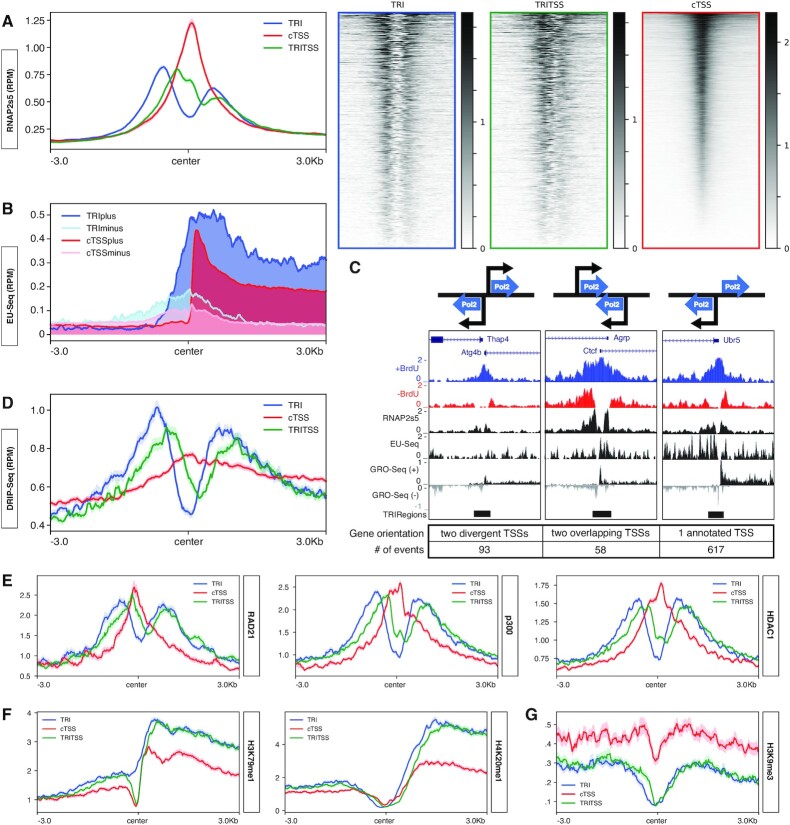
Figure 2.
Characterization of transcriptional activity at TRIs. (A) Median Method 2 RNAP2s5 ChIP-Seq signal profiles centered near TSSs for TRIs (blue, n = 1221), TRITSSs (green, n = 1198) and cTSSs (red, n = 12 957). Median Method 2 RNAP2s5 ChIP-Seq signal heatmaps centered near TSSs for TRIs (blue, n = 1221), TRITSSs (green, n = 1198) and cTSSs (red, n = 1218). (B) Median EU-Seq signal profiles centered near TSSs for plus strand nascent RNA at TRIs (blue), minus strand nascent RNA at TRIs (light blue), plus strand nascent RNA at cTSSs (red) and minus strand nascent RNA at cTSSs (pink). (C) Graphic representation of possible RNAP2s5 orientations and representative UCSC genome browser tracks of RPM normalized reads of (from top to bottom) Mouse Genome Informatics gene annotation, TRI region, TRI control, RNAP2s5 ChIP-Seq, EU-Seq and GRO-Seq, and TRI peak for Ctcf, Gm5914, Thap4, Atg4b and Ubr5. (D) Median DRIP-Seq signal profiles centered near TSSs for TRIs, TRITSSs and cTSSs. (E) Median RAD21, P300 and HDAC1 ChIP-Seq signal profiles in RPKM for TRIs, TRITSSs and cTSSs. (F) Median H3K79me1 and H4K20me1 ChIP-Seq signal profiles in RPKM for TRIs, TRITSSs and cTSSs. (G) Median H3K9me3 ChIP-Seq signal profile in RPKM for TRIs, TRITSSs and cTSSs. *All profile plot analyses are performed in mBCs. Shaded areas on the unfilled line plots are the standard error.

