Figure 3.
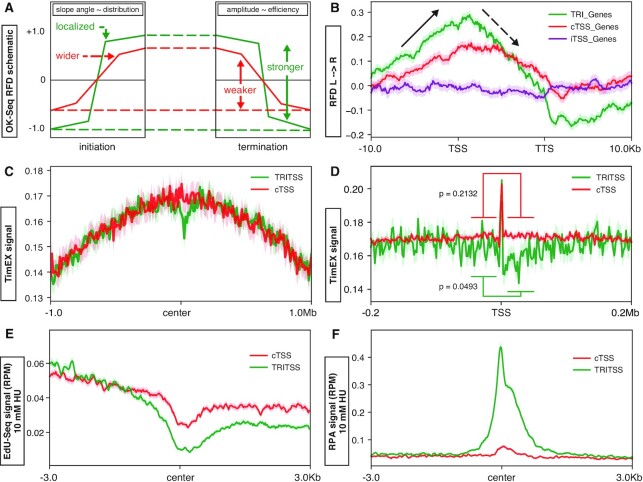
Replication characteristics at TRIs. (A) Graphic representation of example of OK-Seq RFD data and interpretation at replication initiation and termination zones: slope correlates with origin localizartion, and amplitude correlates with origin efficiency. (B) Median OK-Seq signal profile scaled to full genes ±10 kb of TRI genes (green, n = 583), cTSS genes (red, n = 6558) and inactive TSS genes (purple, n = 11 612). Solid black arrows indicate initiation zones and dashed black arrows indicate termination zones. (C) Median TimEX signal profiles centered at TSS ± 1.0 Mb for TRI genes (green) and cTSSs genes (red). (D) Median TimEX signal profiles centered at TSS ± 200 Kb for TRI genes (green) and cTSSs genes (red). (E) Median EdU-Seq signal profiles on cells treated with 10 mM HU centered at TSSs for TRITSSs and cTSSs. (F) Median RPA ChIP-Seq signal profiles on cells treated with 10 mM HU centered at TSSs for TRITSSs and cTSSs For TRIs or TRITSS compared to cTSS, P < 1.0 × 10–250; Wilcoxon rank sum test). *All profile plot analyses are performed in mBCs. Shaded areas on the unfilled line plots are the standard error.

