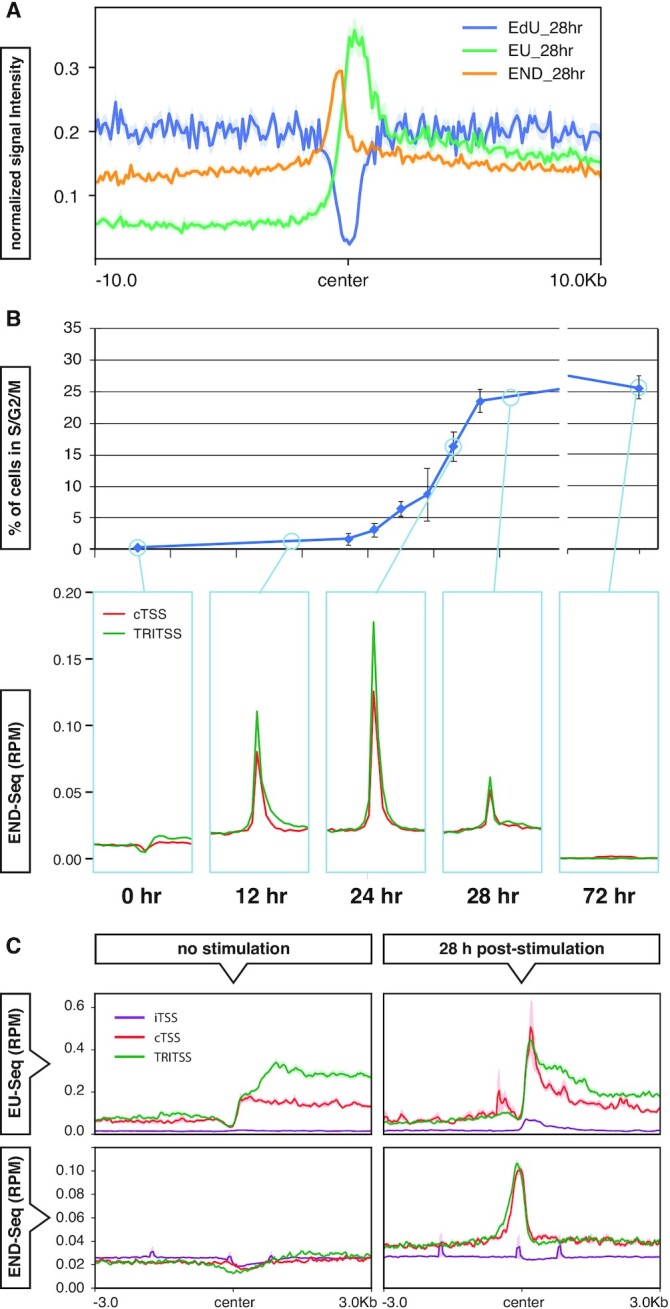
Figure 4.

DNA breaks at TRIs. (A) Median signal profiles centered at TRIs of EdU-Seq (blue), EU-Seq (green) and END-Seq (orange) from 28 h NT cells. The EdU-Seq and END-Seq signal was multipled by 8 and 4 respectively so the signals can be seen clearly on the same scale. (B) Top graph showing the percentage of B cells in S and G2/M phases measured by PI incorporation and analyzed by FACS. Bottom of the panel showing END-Seq signal profile at 0, 12, 24, 28 and 72 h time points from NT cells centered near TSSs of TRITSSs (green) and cTSSs (red). (C) Median signal profiles of EU-Seq (top) and END-Seq 0 mM HU (bottom) of non-replicating resting (left) and 28 h activated replicating mouse B cells (right) centered near TSSs of TRITSSs (green), cTSSs (red) and inactive TSSs (purple). *All profile plot analyses are performed in mBCs. Shaded areas on the unfilled line plots are the standard error.
