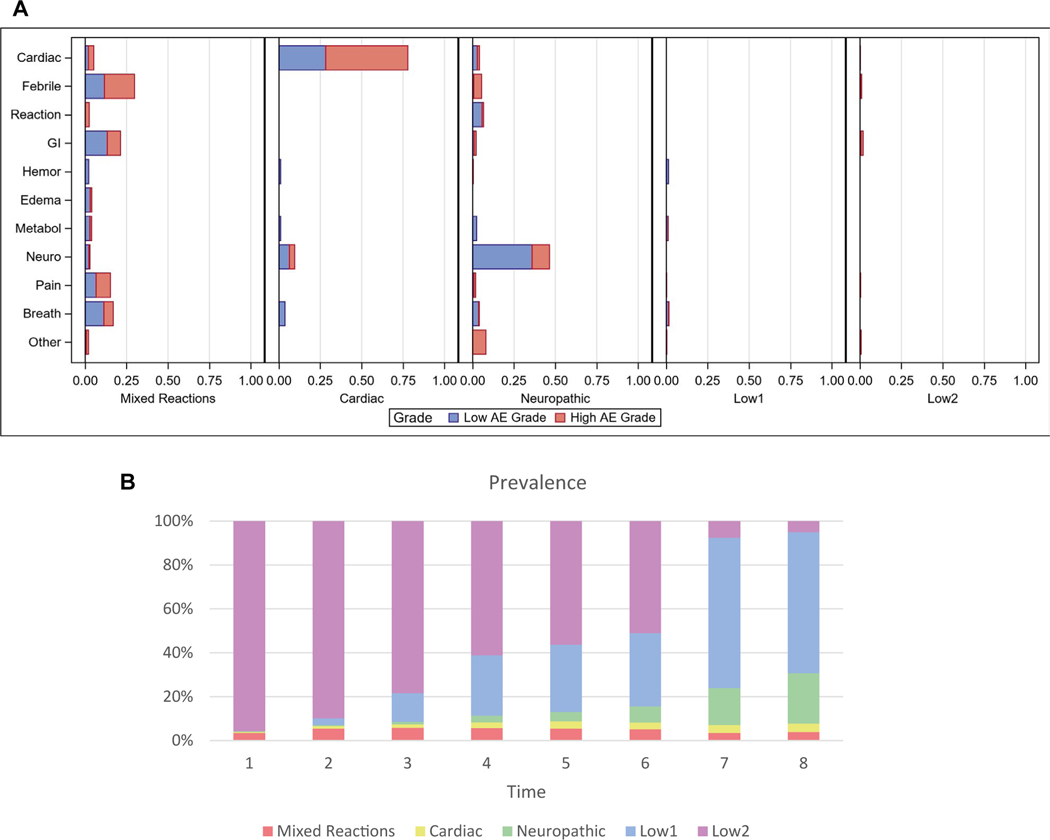
Figure 2.
(A) Profiles of the AE states. Each bar indicates the probability of having the specific AE and grade (1–2 = low; 3–4 = high). (B) Prevalence of AE states over 8 cycles. The order for the states from top to bottom is as follows: Low 2, Low 1, Neuropathic, Cardiac, and Mixed Reactions. AE indicates adverse event; breath, breathing-related; GI, gastrointestinal; hemor, hemorrhage; metabol, metabolic; neuro, neuropathic; reaction, reaction-related.

