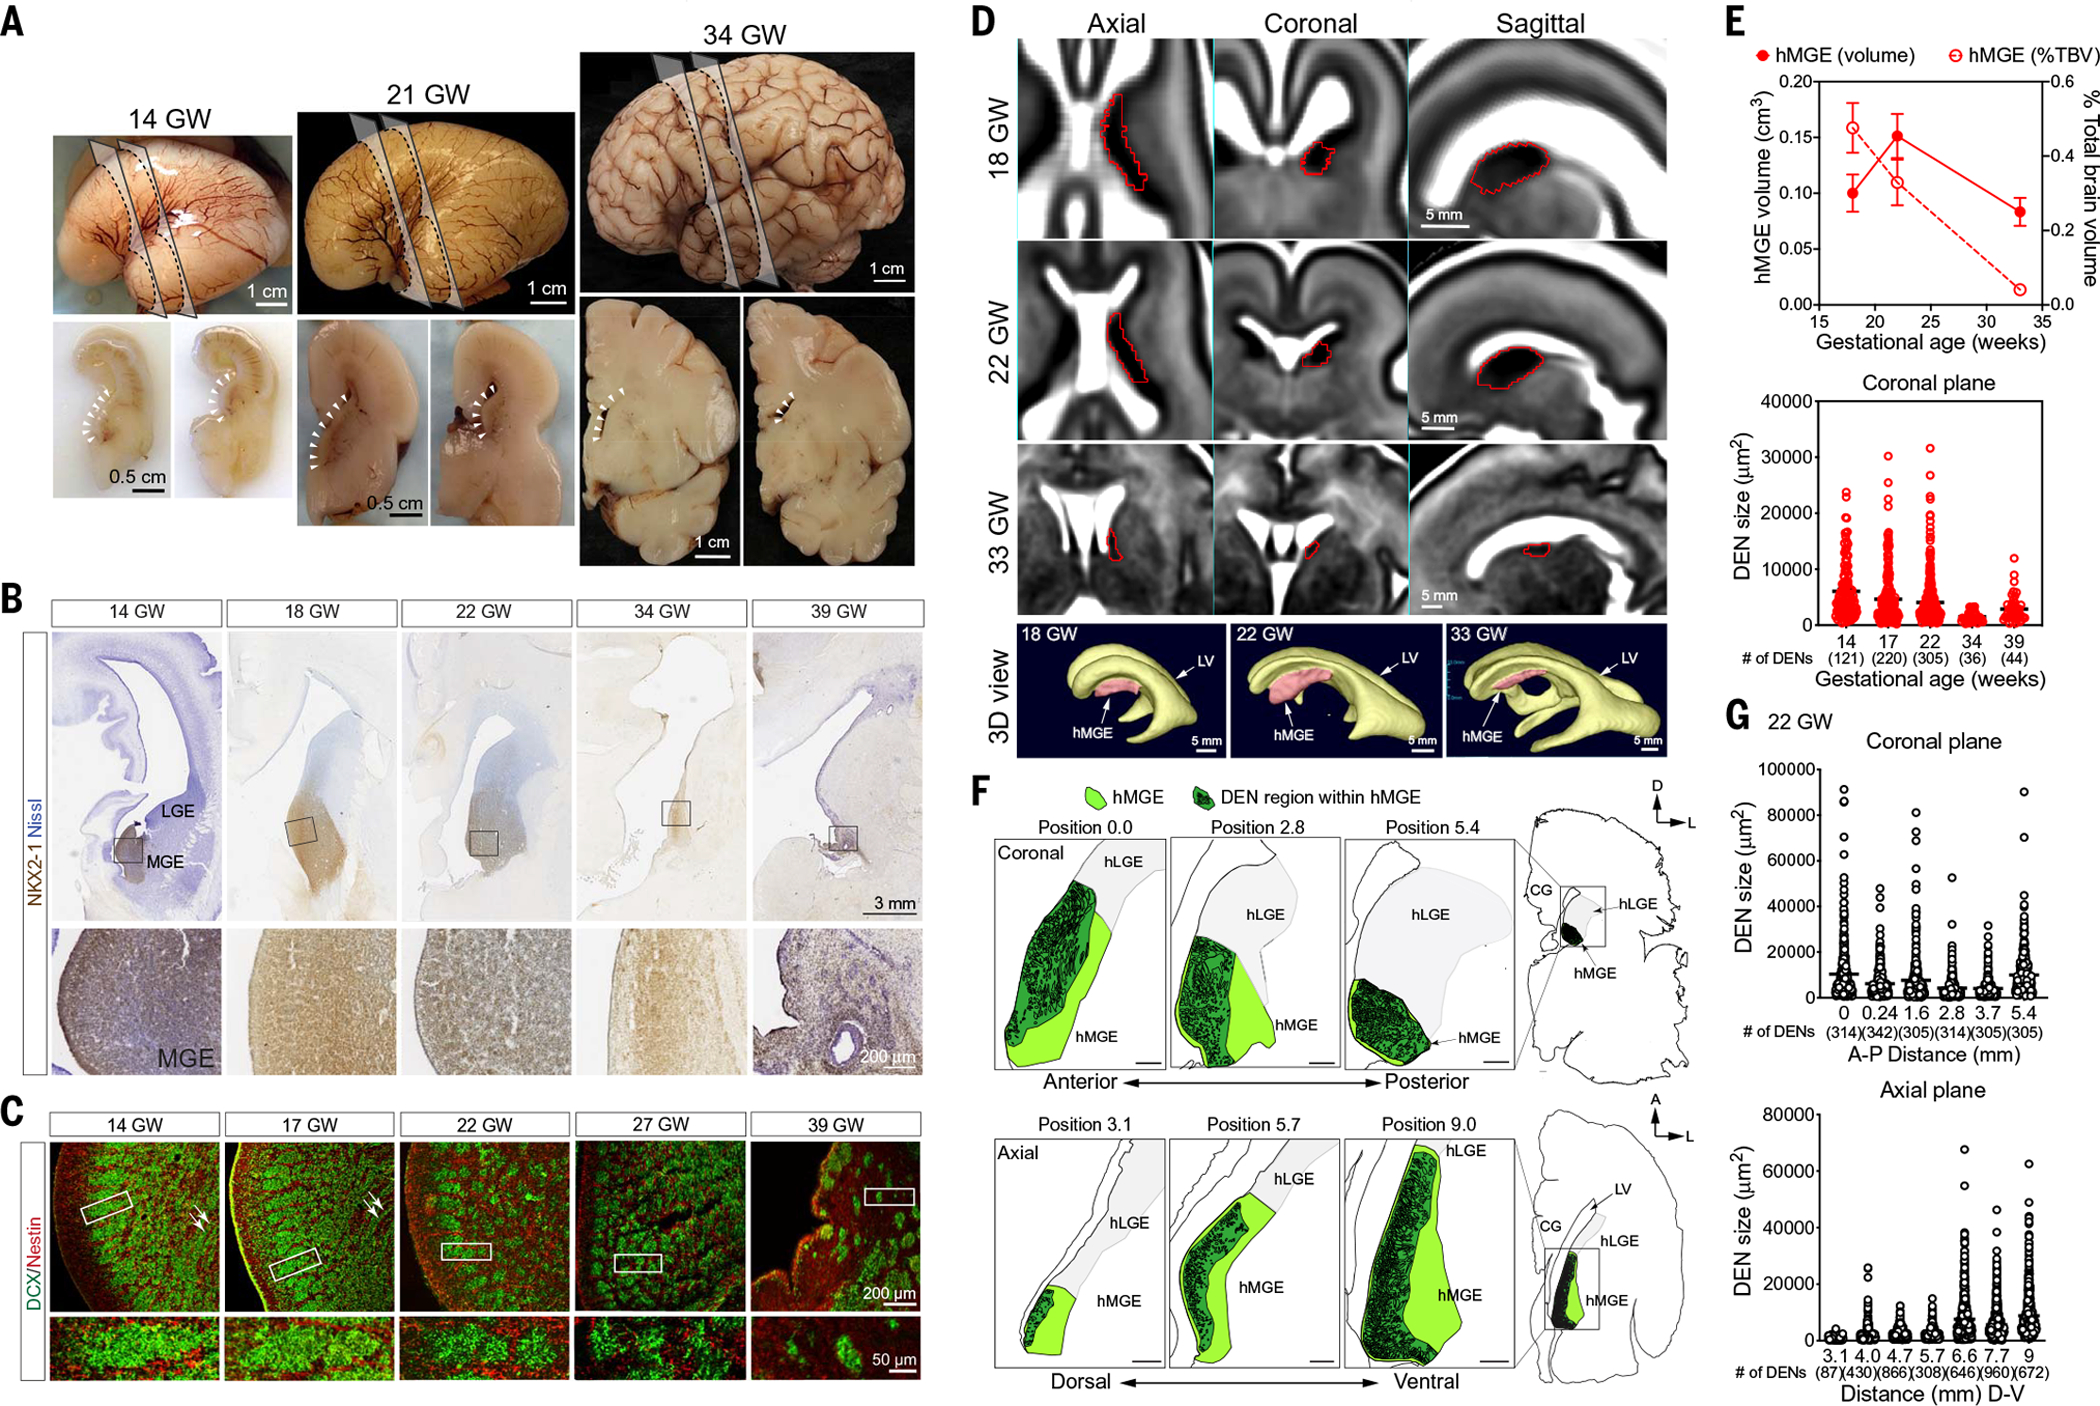
Fig. 1. hMGE organization in the prenatal and perinatal brain.

(A) Lateral views (top) and coronal cross sections (bottom) of the prenatal human brain at 14, 21, and 33 GW. Dashed lines indicate the locations where the coronal sections are made; arrowheads indicate the location of human ganglionic eminences located next to the lateral walls of the lateral ventricles. (B) Immunohistochemical stains for NKX2-1 in the hMGE at 14, 18, 22, 34, and 39 GW. NKX2-1 shows a robust expression from 14 to 22 GW. Despite the decrease in hMGE size at 34 GW, NKX2-1 expression remains high. At 39 GW, NKX2-1 expression in the hMGE is reduced to a thin slit along the subventricular zone. (C) Confocal images of the hMGE from 14 to 39 GW reveal the unique organization of dense DCX+ nests that intermix with nestin+ fibers. (D) MRI images of prenatal hMGE (highlighted in red) on the axial, coronal, and sagittal planes at 18, 22, and 33 GW. Three-dimensional (3D) reconstruction highlights the position of the hMGE in relationship to the lateral ventricle (LV) at the respective ages. (E) Top: Quantification of hMGE volume relative to total brain volume by MRI images at 18, 22, and 33 GW. By cross-referencing NKX2-1 expression patterns and MRI images of human GE, we found that hMGE volume increased from 115 + 15 mm3 at 18 GW to 158 + 13 mm3 at 22 GW, then decreased to 88 + 3 mm3 at 33 GW. Data are means ± SD; n = 10 each gestational age. Bottom: Quantification of the size of DEN in hMGE on the coronal planes shows the progressive reduction in size from 14 to 39 GW. The average area of a DEN in coronal sections decreased from 6053 + 452 μm2 at 14 GW to 4052 + 242 μm2 at 22 GW, and dropped further to 2870 + 360 μm2 39 GW. The number of DENs for each gestational age is included in parentheses. (F) Schematic diagrams highlighting DENs (dark green) in hMGE (light green) in 22 GW prenatal brain at the coronal plane (top) and axial plane (bottom) relatively similar sizes of DCX+ nests. The adjacent hLGE is shaded light gray. The positions of the hMGE indicated on the coronal plane are from anterior (position 0.0) to posterior (position 5.4). On the axial plane, the positions of the hMGE are from top (position 3.1) to bottom (position 9.0). Scale bars, 500 μm (G) Top: Quantification of DEN size in the hMGE at 22 GW shows similar sizes from anterior to posterior on the coronal plane. Bottom: DEN size appears to become progressively larger from top to bottom on the axial plane.
