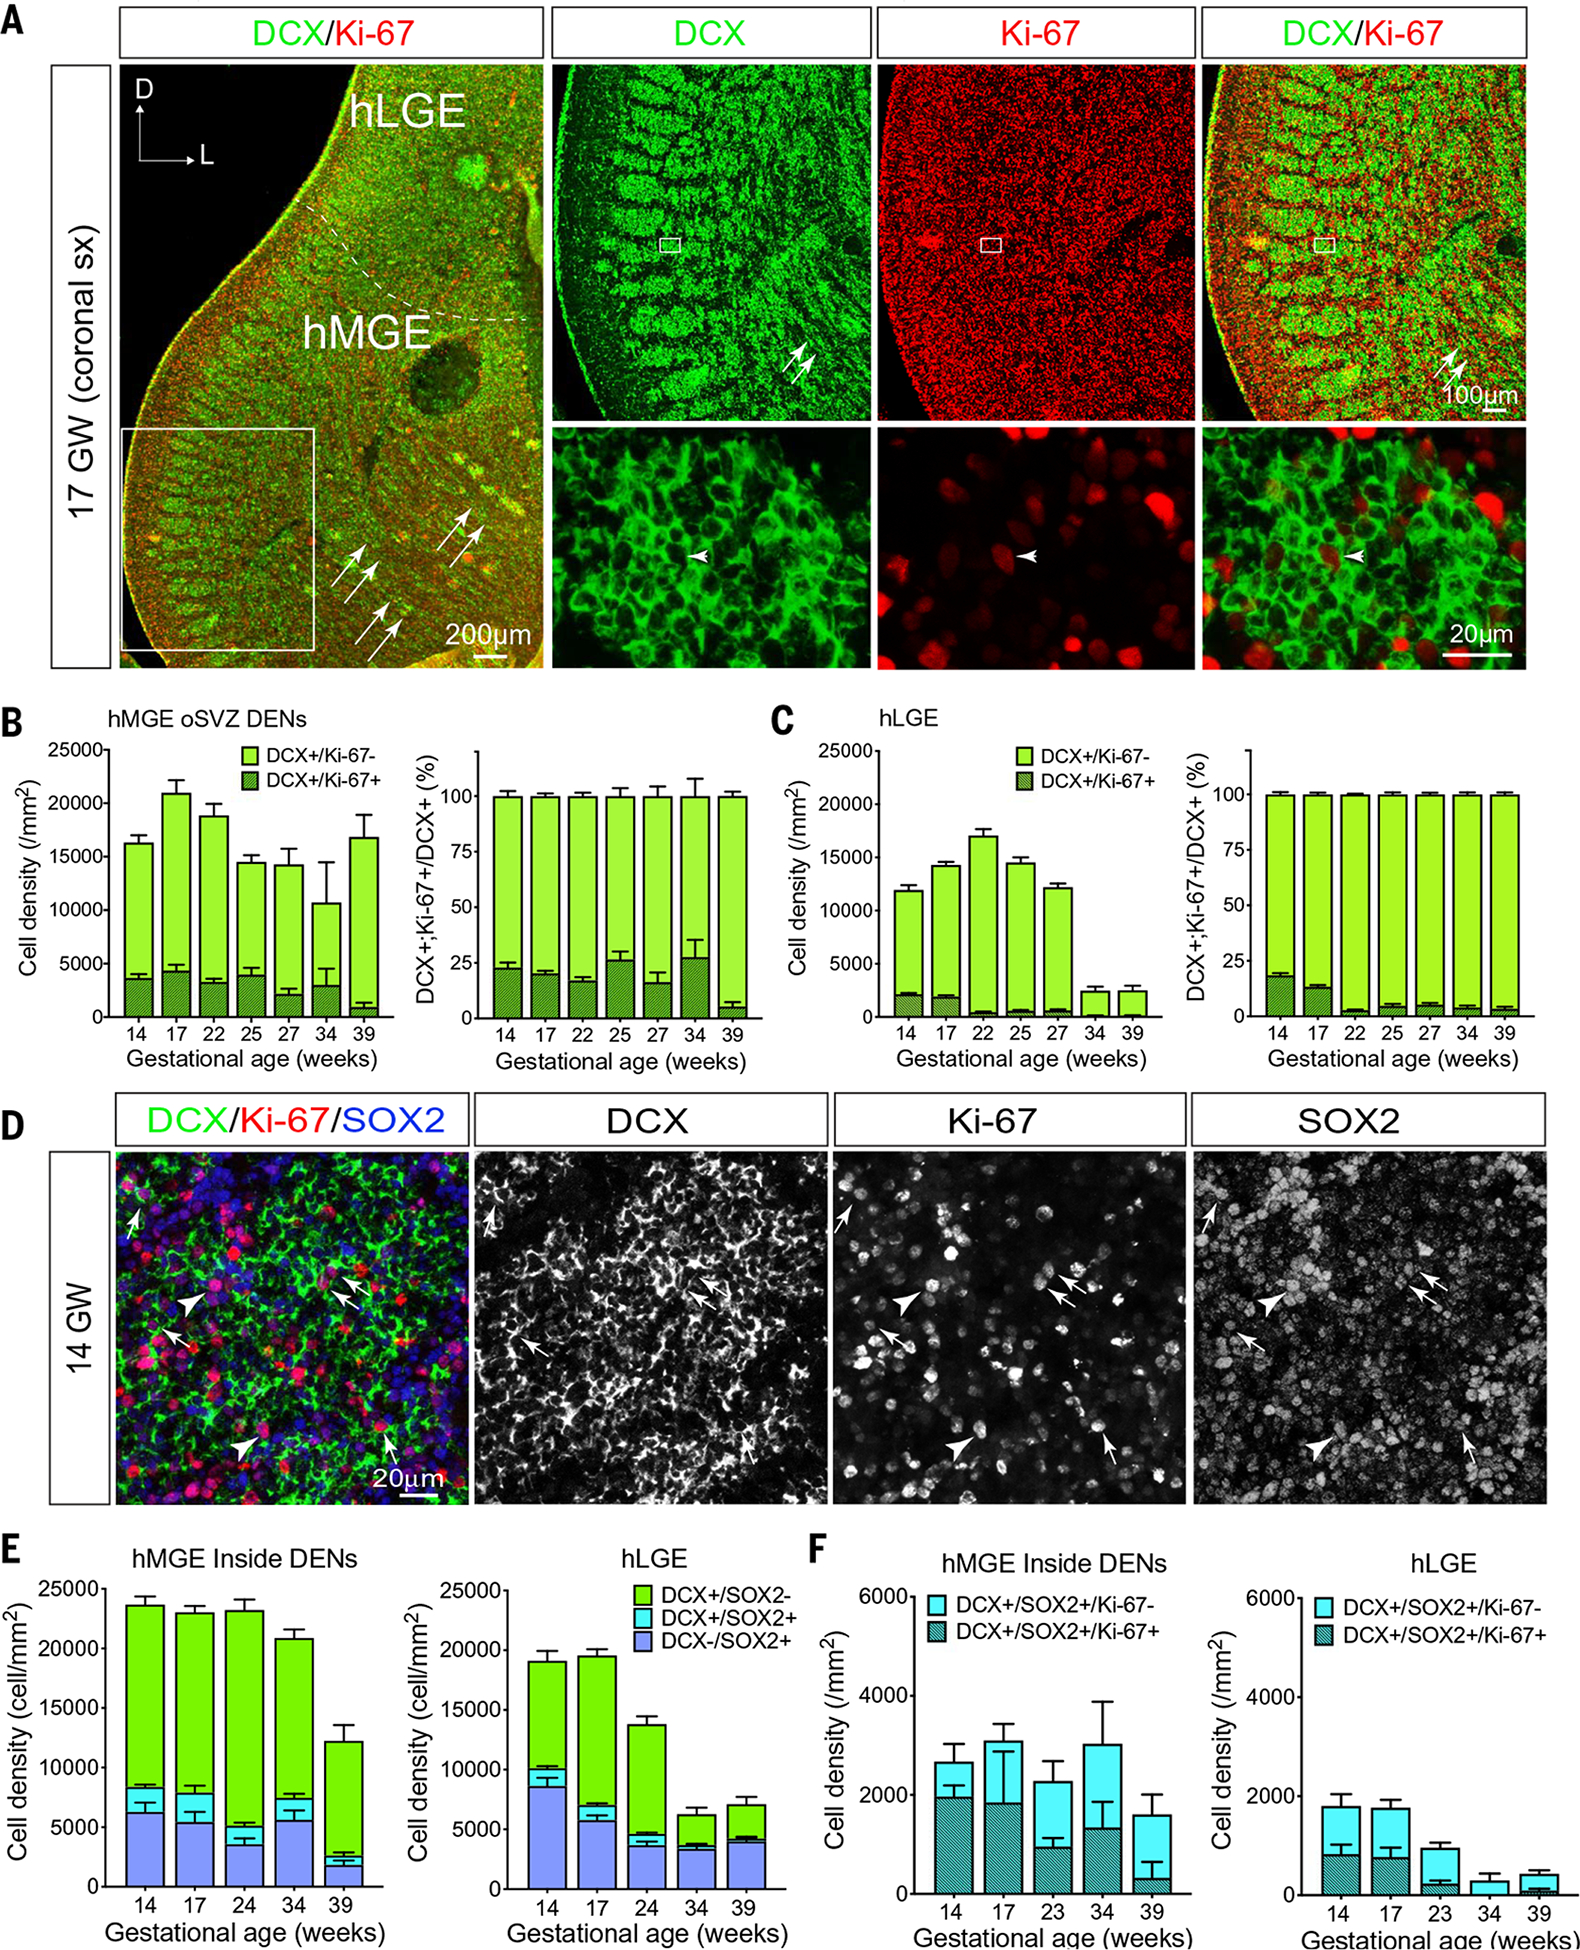
Fig. 3. DCX+ cells proliferate in the human ganglionic eminences.

(A) Left: Confocal image of a coronal section of 17 GW hMGE and hLGE immunostained with DCX (green) and Ki-67 (red). Dashed line highlights the boundary that separates the hLGE and hMGE; arrows indicate streams of DCX+ cells migrating away from DENs at the edge of the hMGE. Right: Higher magnifications of DENs in the boxed area in the left panel (top row) where many DCX+ cells show positive staining for Ki-67 (bottom row); arrowhead points to a DCX+/Ki-67+ cell in DENs. (B and C) Quantification of DCX+/Ki-67+ cells and DCX+/Ki-67− cells in hMGE (B) and hLGE (C) at 14, 17, 22, 25, 27, 34, and 39 GW. DCX+/Ki-67+ cells and DCX+/Ki-67− cells are presented as cell density (number of cells per mm2) (left panels); in addition, DCX+/Ki-67+ cells are presented as the percentage of DCX+ cells (right panels). Data are means ± SEM. (D) Confocal images of hMGE at 14 GW immunostained with DCX, Ki-67, and SOX2 antibodies. Arrows in the merged panel and individual channels highlight DCX+/SOX2+/Ki-67+ cells; arrowhead indicates a DCX−/SOX2+/Ki-67+ cell within DENs. (E and F) Quantifications DCX+/SOX2−, DCX+/SOX2+, and DCX−/SOX2+ progenitors (E) and DCX+/SOX2+ progenitors that are still in the cell cycle (Ki-67+ already exited cell cycle (Ki-67−) (F) in hMGE and hLGE at 14, 17, 24, 34, and 39 GW. Data are means ± SEM and are presented as cell density (number of cells per mm2).
