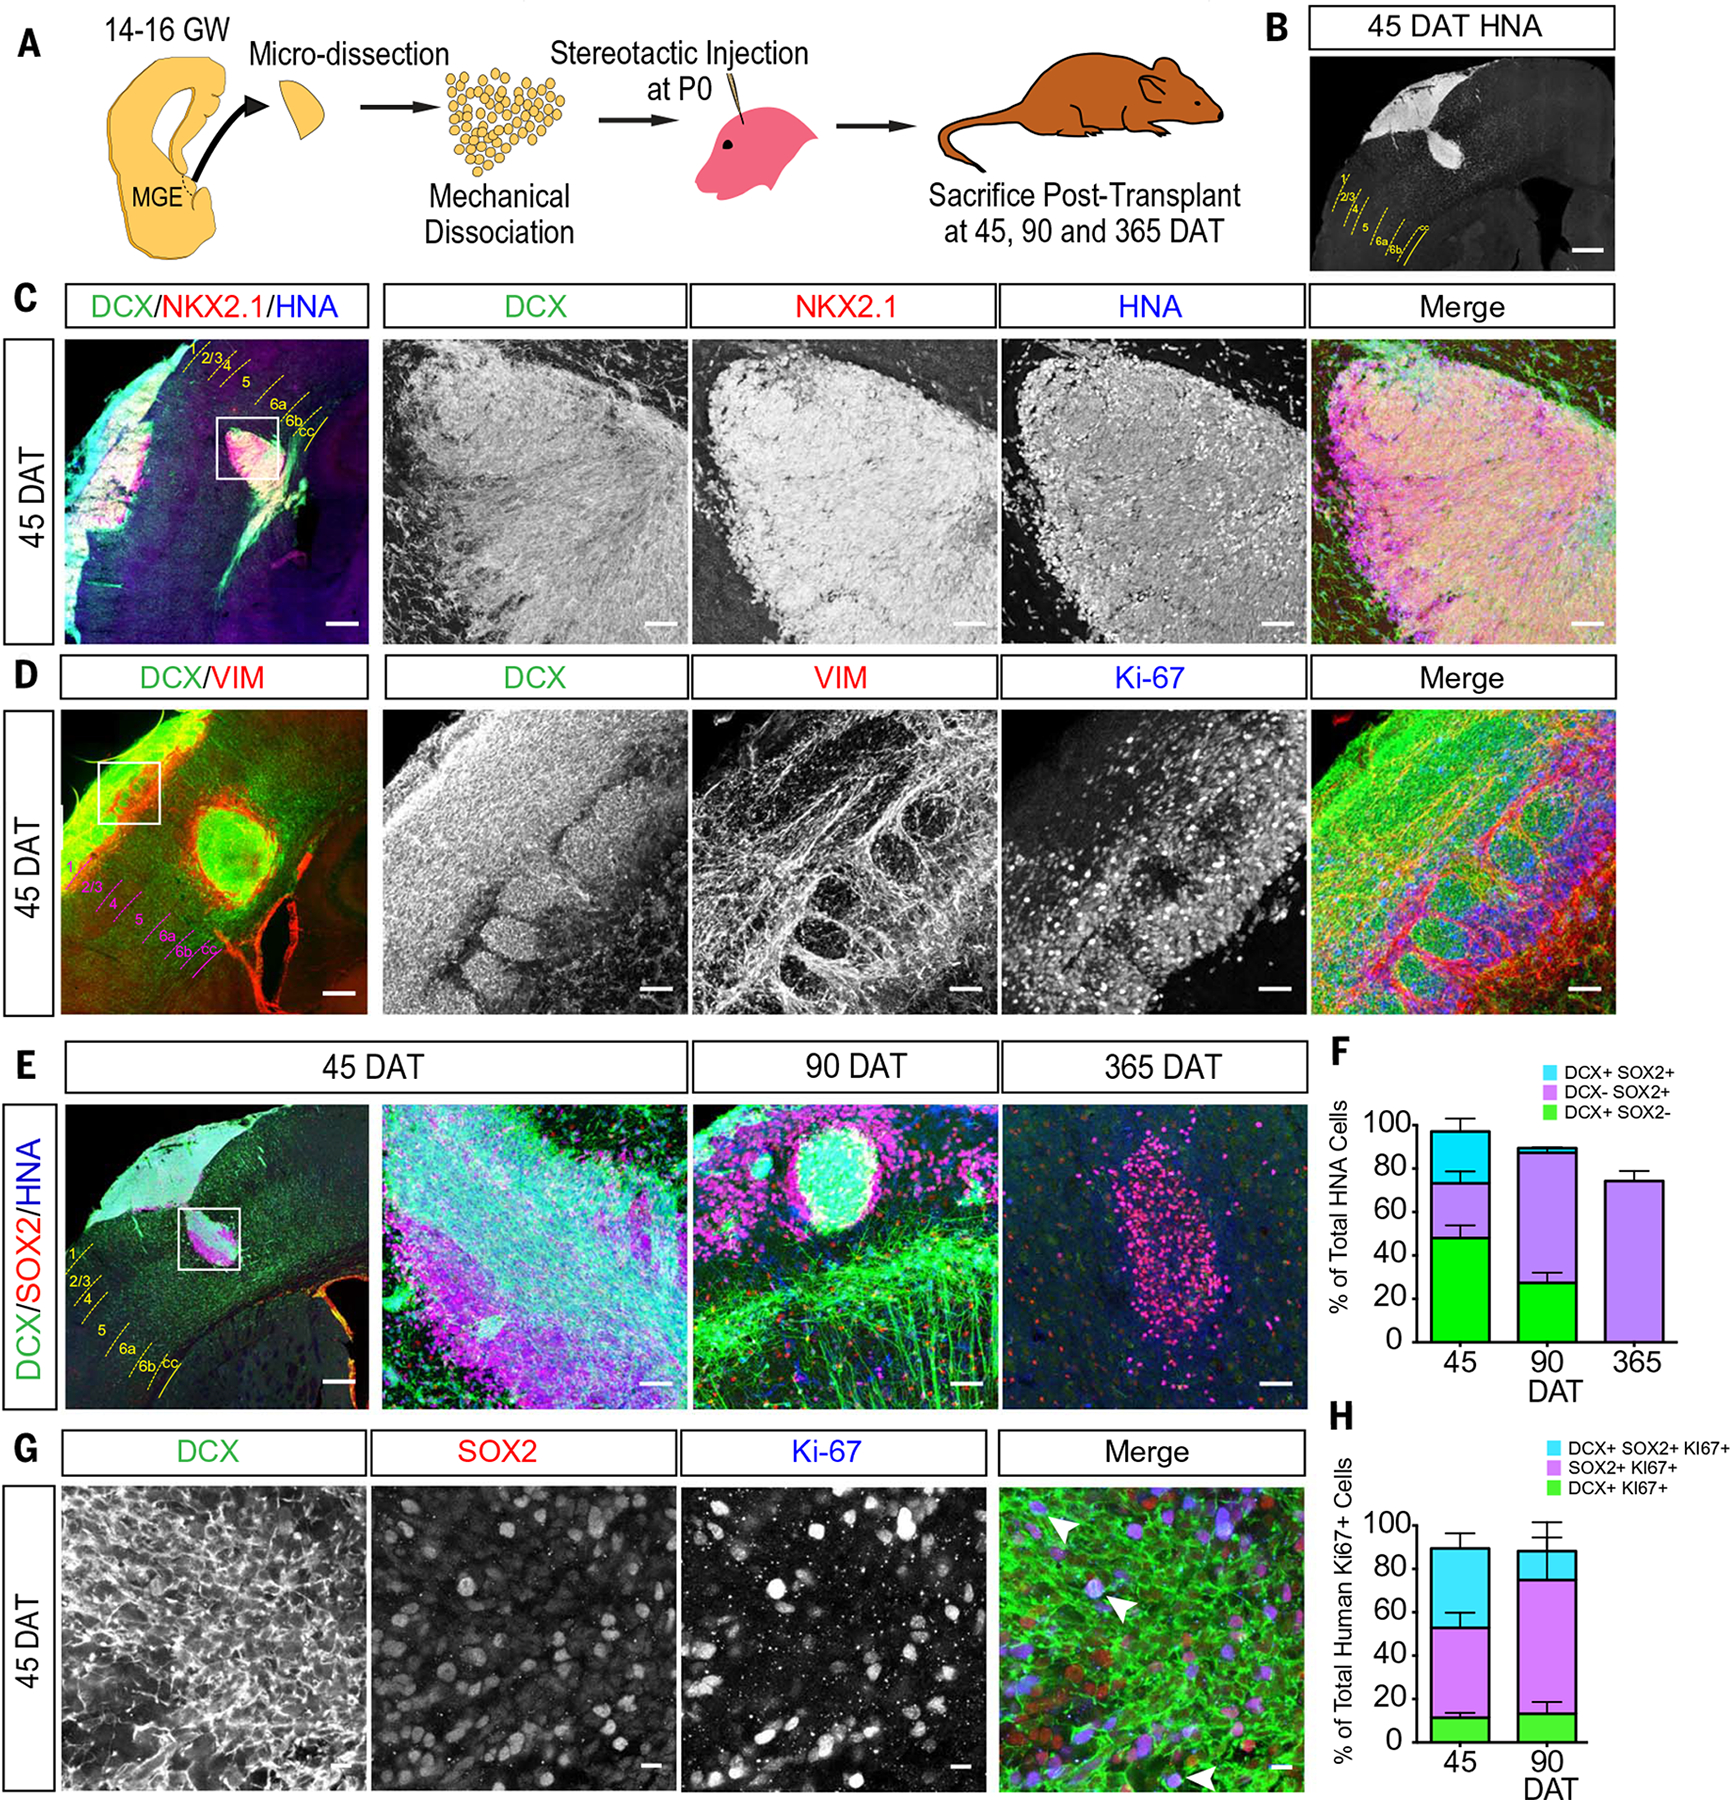
Fig. 4. Transplanted hMGE cells recapitulate DEN organization and proliferation.

(A) Schematic of hMGE transplantation surgery. (B) Coronal section indicating injection site of HNA+ cells (white) at 45 DAT. Dashed lines delimit cortical layers; cc, corpus callosum. (C) HNA+ cells at the injection site at 45 DAT express DCX and NKX2.1. The transplant (boxed area of the leftmost panel) is shown at higher magnification. (D) Transplanted hMGE cells form dense DCX+ nests encased by VIM+ radial glia fibers at the site of injection at 45 DAT. The transplant (boxed area of the leftmost panel) is shown at higher magnification. Many VIM+ and DCX+ cells are Ki-67+. (E) HNA+ (blue) cells at injection sites express DCX and SOX2 at 45, 90, and 365 DAT. (F) Quantification of proportion of total HNA+ cells at the injection site (45 DAT, n = 4; 90 DAT, n = 2; 365 DAT, n = 3) that are DCX+ (green), SOX2+ (purple), or DCX+/SOX2+ (cyan). Data are means ± SEM. (G) High magnification of DCX+, SOX2+, and Ki-67+ cells in DENs at 45 DAT. (H) Quantification of proportion of HNA+/Ki-67+ cells at the injection site (45 DAT, n = 4; 90 DAT, n = 2; 365 DAT, n = 3) that are DCX+ (green), SOX2+ (purple), or DCX+/SOX2+ (cyan). Data are means ± SEM. Scale bars, 500 mm [(B) and leftmost panel in (C) to (E)], 50 μm [other panels in (C) to (E)], 10 μm (G).
