
Fig. 3. Loss of anti-silencer destabilizes CD4 T cell phenotype.
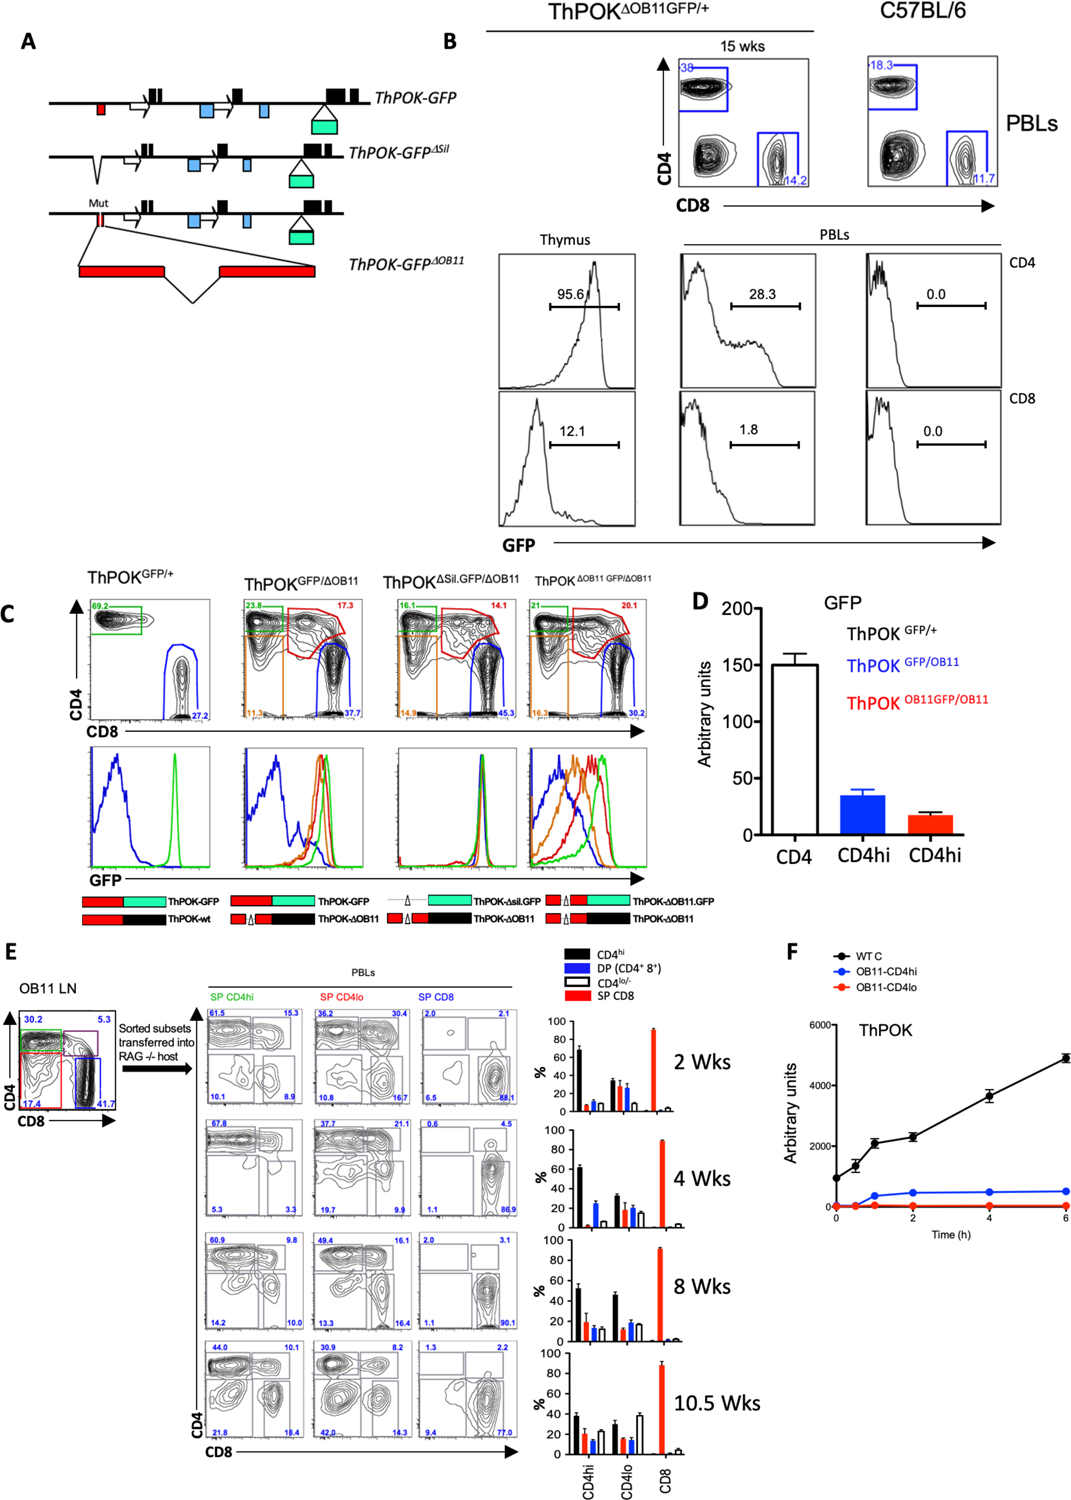
a) Structure of ThPOKGFP, ThPOKΔSil.GFP, and ThPOKDOB11.GFP reporter alleles, showing insertion site of GFP-encoding exon (labeling of elements as in Fig. 1a). b) FACS analysis of CD4, and CD8a expression in total PBLs of WT mice and heterozygous ThPOKΔOB11.GFP/+ mice (top), and GFP expression of gated SP CD4 and CD8 population from PBLs of same mice (bottom rows). c) FACS analysis of CD4, and CD8a expression in gated TCRβ+ PBLs (top), or GFP expression of gated CD4hi (green), CD4lo/− (orange), CD4+ CD8+ (red), or CD8 PBLs (middle), of WT mice and indicated compound heterozygous reporter lines. Bottom row illustrates ThPOK alleles of indicated mouse. Red box represents silencer (thin black line shows extent of deletion); green and black boxes indicate whether allele expresses GFP or ThPOK mRNA. d) RNA was collected from freshly sorted CD4 T cells from ThPOKGFP/+ (white), ThPOKΔOB11.GFP/ΔOB11(red), or ThPOKGFP/ΔOB11 (blue) mice and probed for GFP mRNA expression by qPCR. e) Reconstitution of RAG−/− hosts with CD4hi, CD4lo and SP CD8 cells from ThPOKΔOB11.GFP/ΔOB11 donor mice. FACS analysis showing sort gates for isolation of donor cells (upper left panel). FACS analysis of CD4 and CD8 expression by PBLs from reconstituted hosts at indicated time after transfer (next 3 columns). Plots at right indicate % of CD4hi, CD4lo/−, CD4+ 8+ (DP) and CD8 cells within gated TCRβ+ PBLs of mice reconstituted with indicated ThPOKΔOB11/ΔOB11 donor cells, at each time point. Error bars represent standard deviations of 4 biological replicates. f) Sorted T cell population from indicated mice were stimulated with anti-TCRβ. RNA was prepared at different hour of probed for ThPOK mRNA expression by qPCR.