
FIGURE 1.
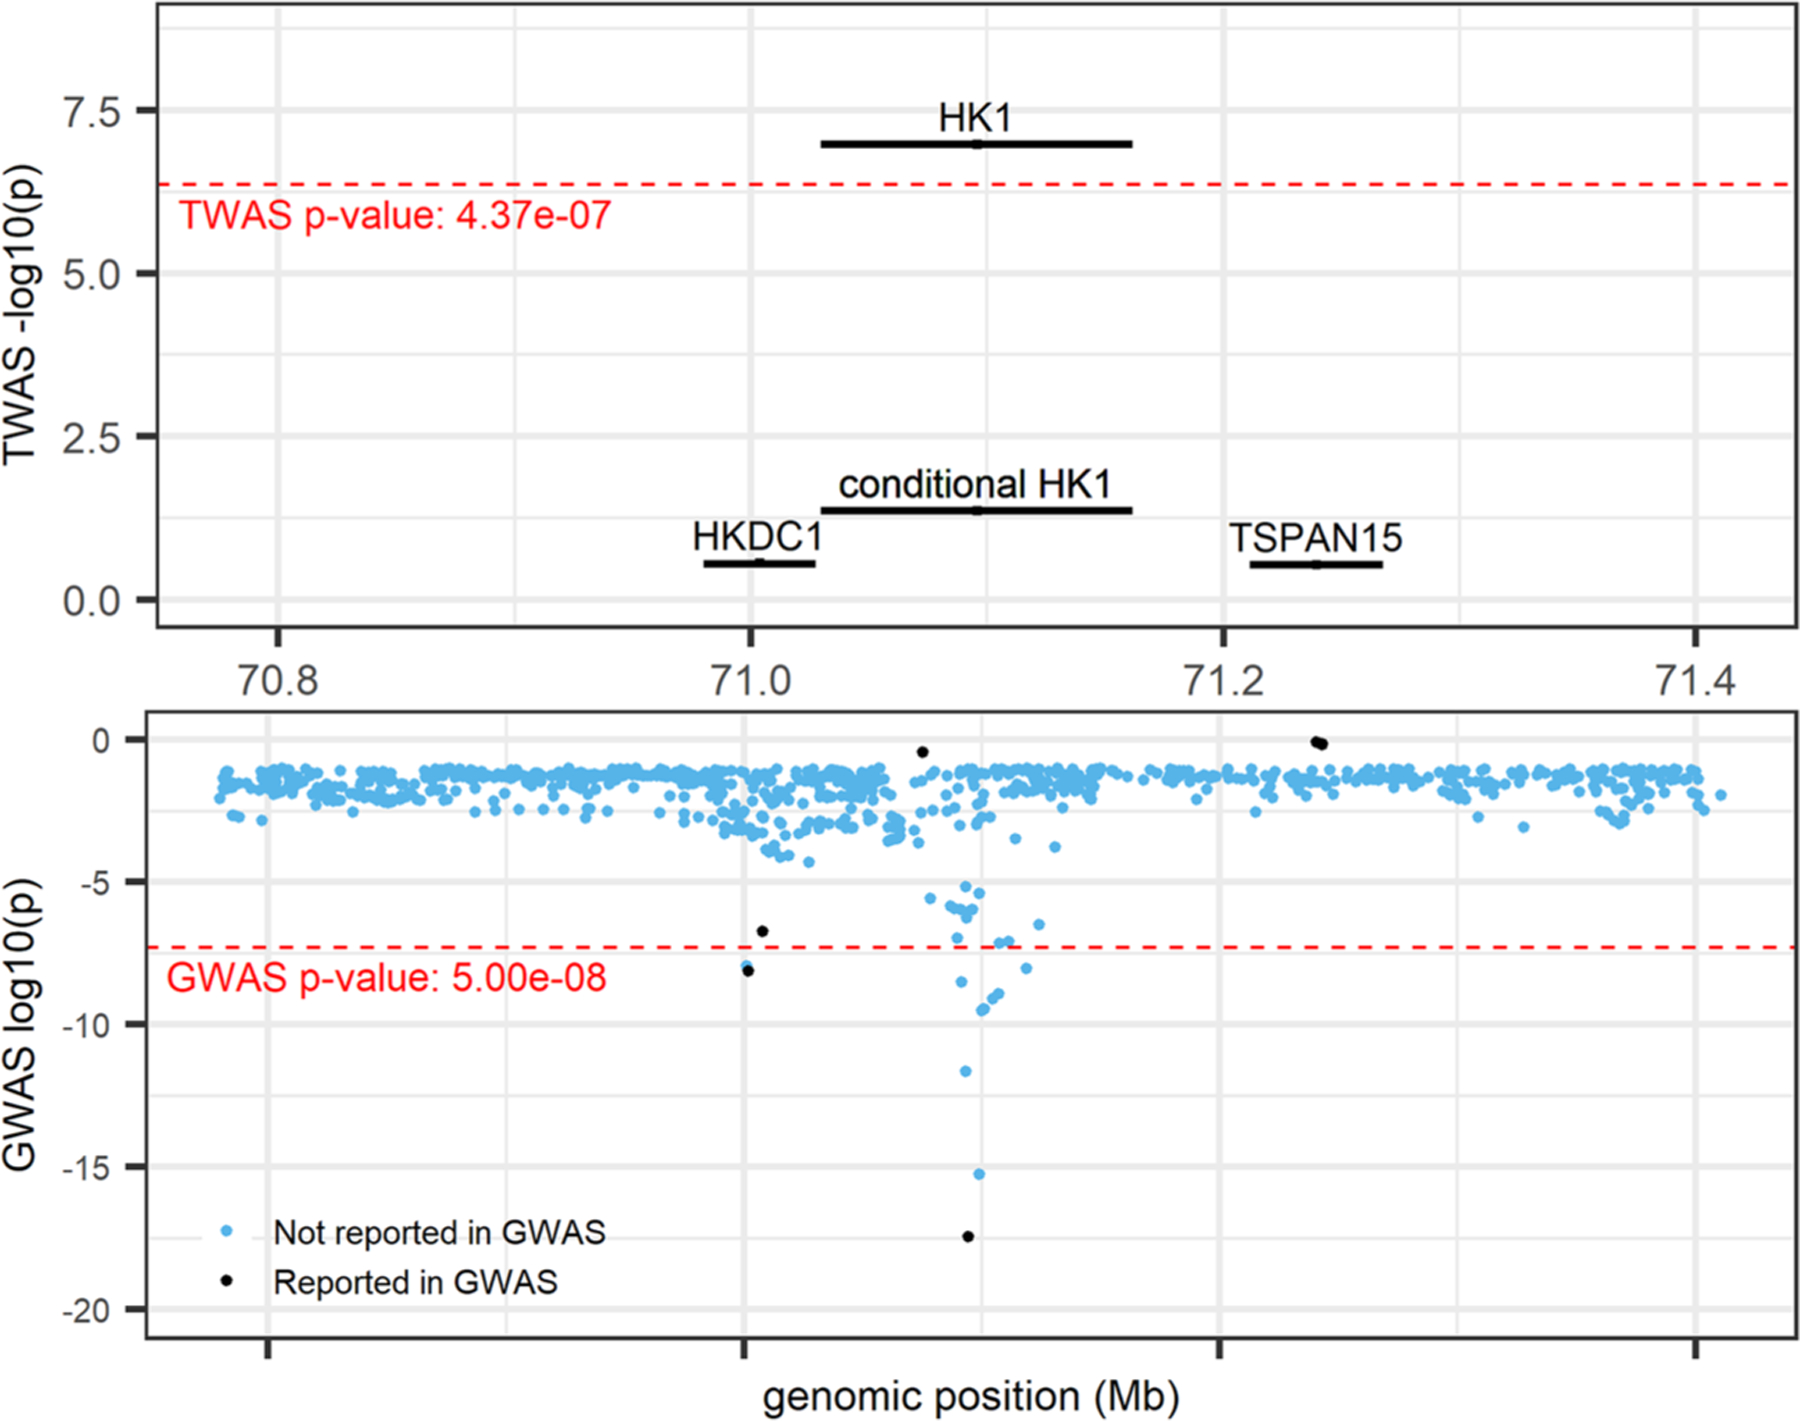
HK1locus (locus 60; chr 10: 70,029,740–72,161,638; trait = MCV) from R Shiny. TWAS results (top panel) and GWAS results (bottom panel). Marginal and conditional results for HK1 are presented in the top panel. Black-colored genes and variants denote those previously reported by UK Biobank and BCX GWAS (Vuckovic et al., 2020), blue variants denote those not previously reported as UK Biobank and BCX GWAS sentinel variants. GWAS, genome-wide association studies; TWAS, transcriptome-wide association study