
FIGURE 2.
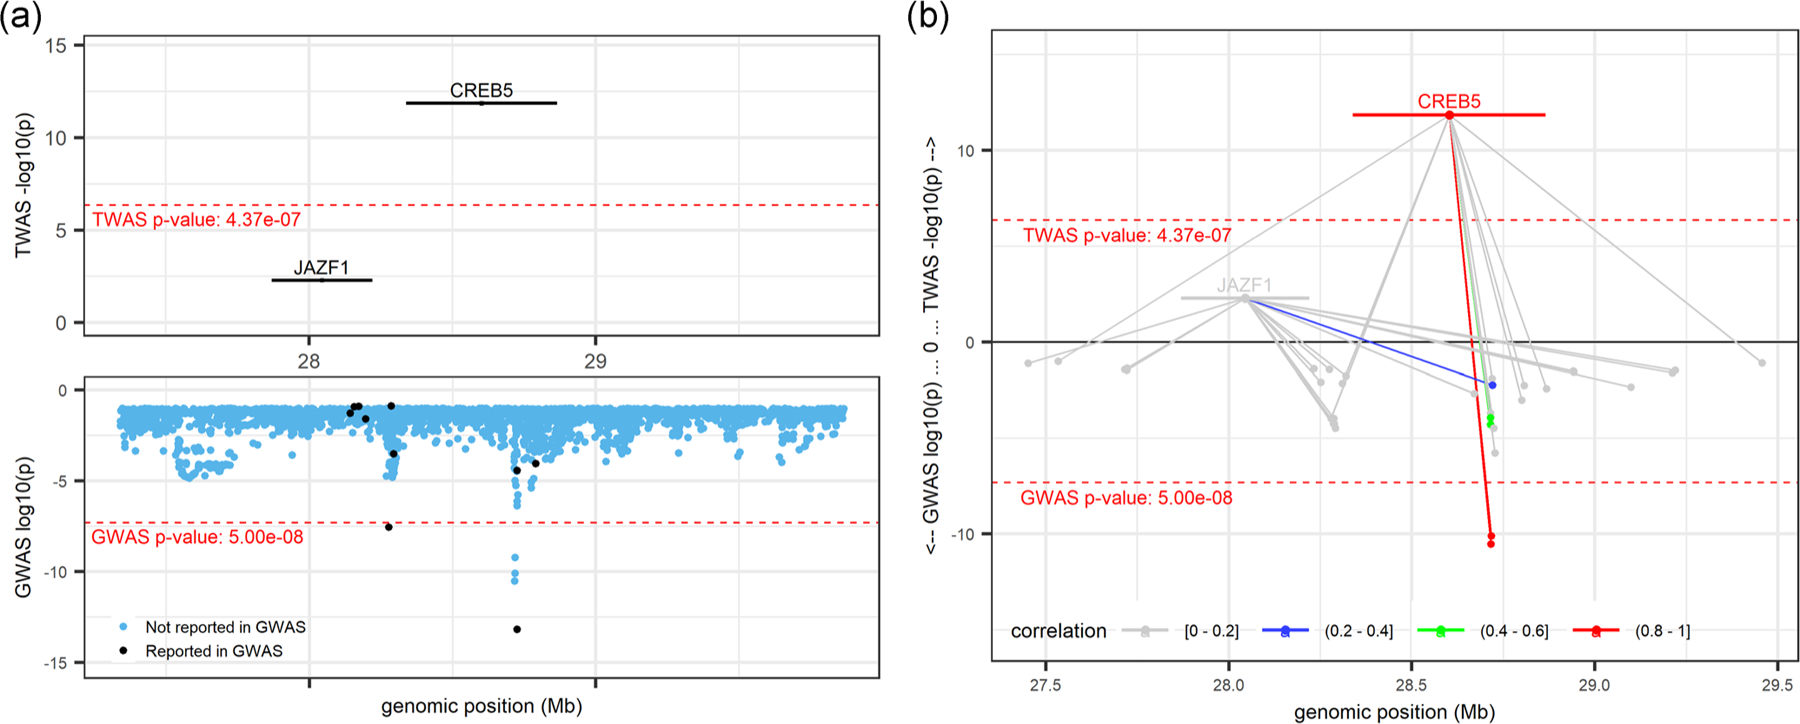
CREB5locus (locus 40; chr 7: 27,338,940–29,865,511; trait = NEUTRO) from R Shiny. TWAS results (top panels) and GWAS results (bottom panels). Marginal TWAS result displayed in (a), with Black-colored genes and variants denoting those previously reported by GWAS, blue variants denote those not previously reported as GWAS sentinel variants. (b) Mirrored-Manhattan locus-zoom plot displaying genes connected to their predictive model variants. Color scale, increasing from light gray to red, indicates the predicted expression correlation (r2) between the index TWAS gene and all other genes in the locus and the LD between the index variant and all other variants in the locus. GWAS, genome-wide association studies; TWAS, transcriptome-wide association study