
FIGURE 4.
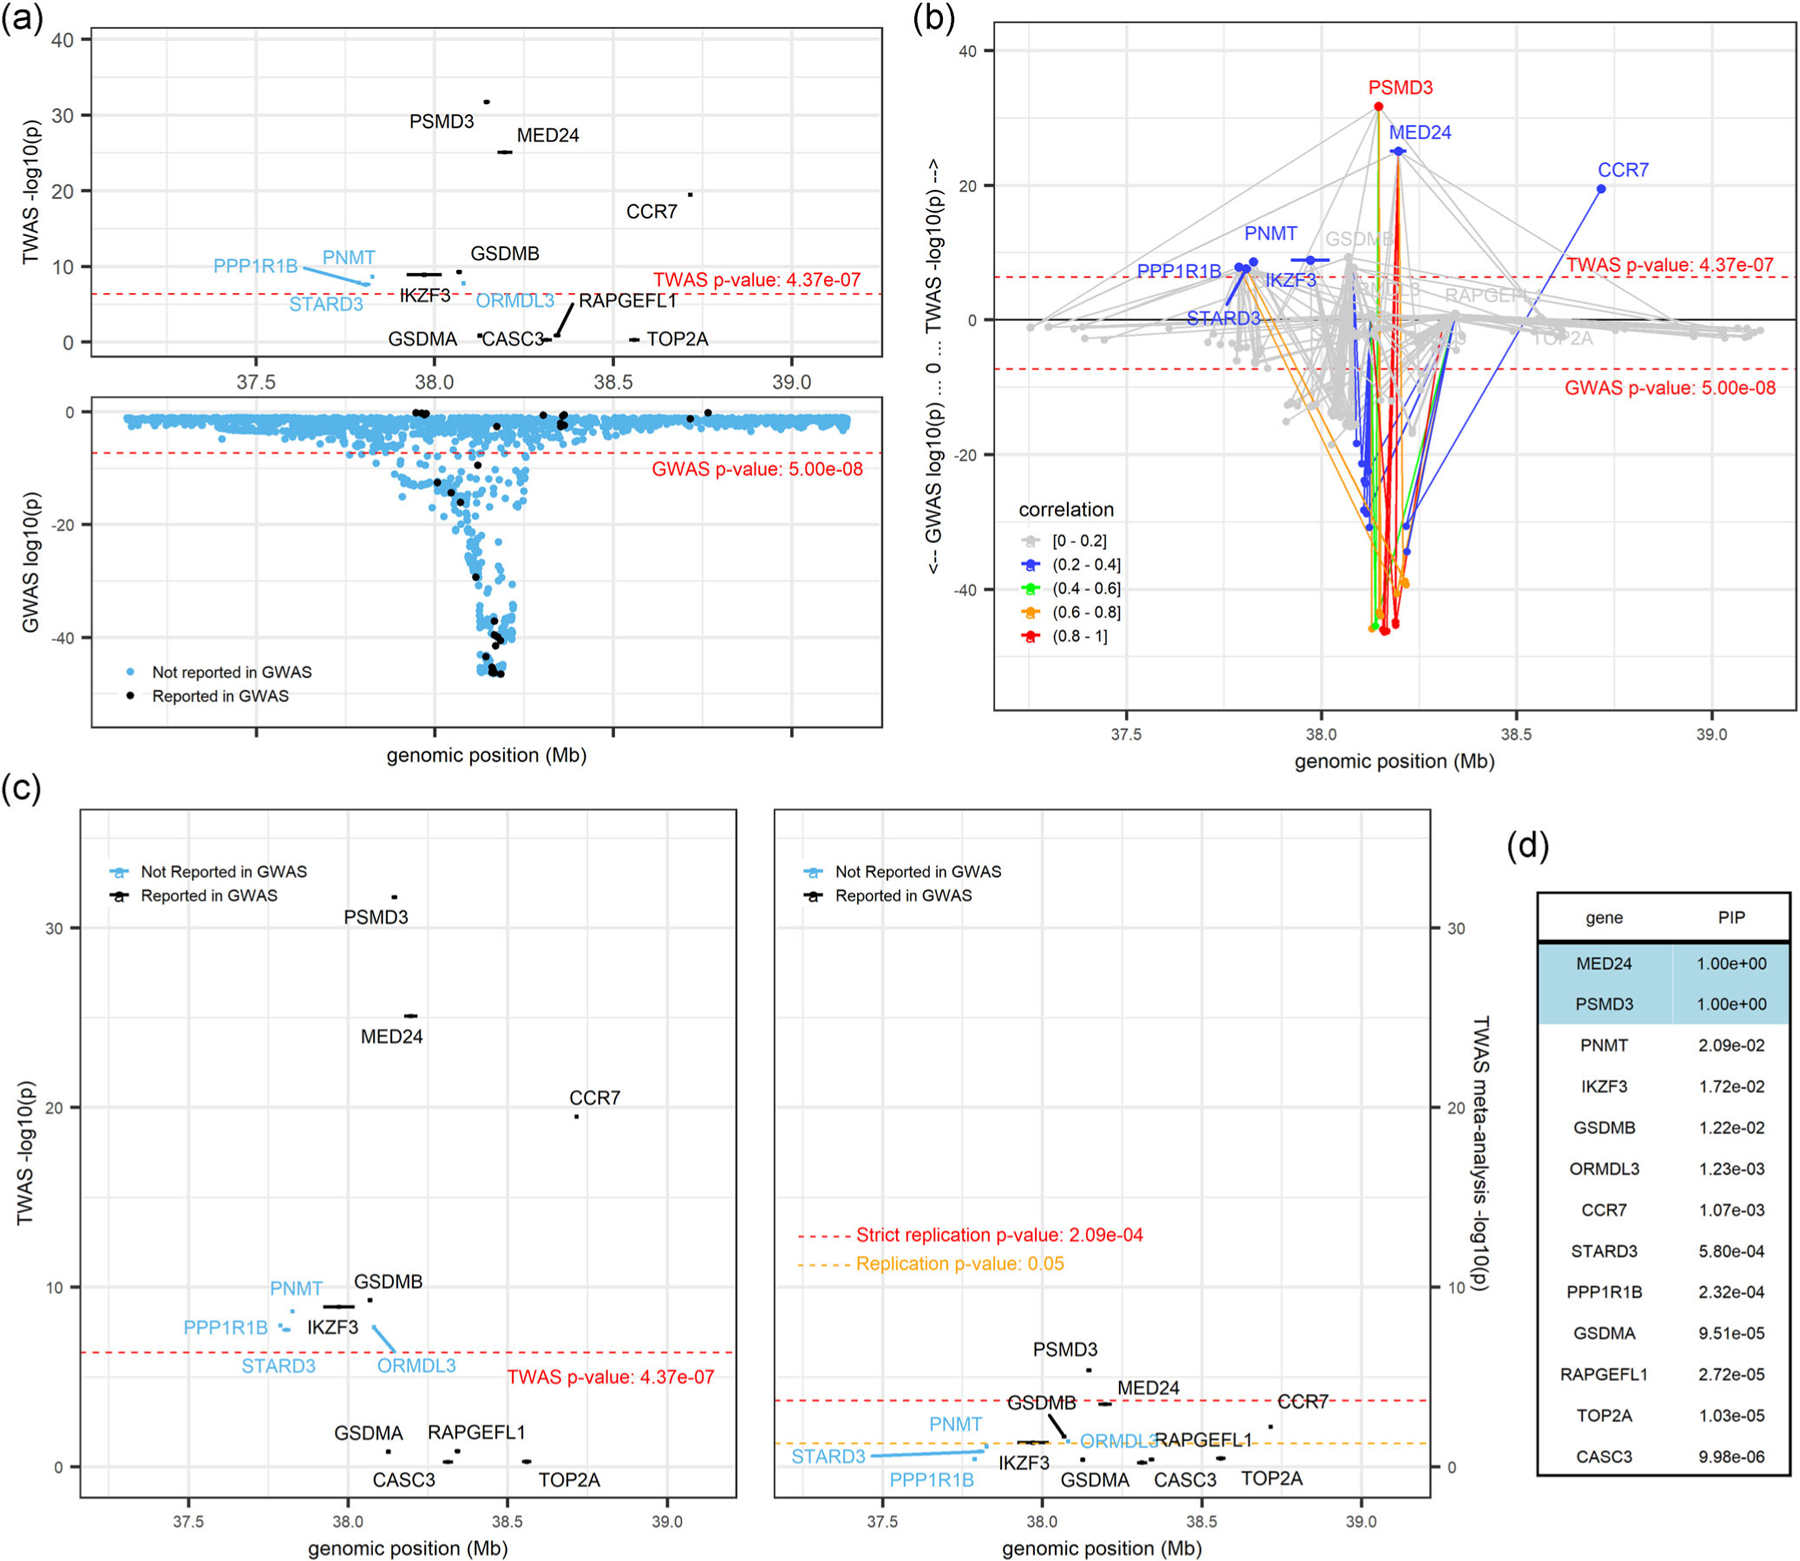
PSMD3locus (locus 101; chr 17: 37,137,050–39,154,213; trait = white blood cell count). (a) displays marginal TWAS results (top panel) and GWAS results (bottom panel), with genes and variants colored in blue and black to denote those not reported by GWAS and those reported by GWAS, respectively. (b) is a mirrored-Manhattan locus-zoom plot displaying genes connected to their predictive model variants with TWAS results (top panel) and GWAS results (bottom panel). Color scale, increasing from light gray to red, indicates the predicted expression correlation (r2) between the index TWAS gene and all other genes in the locus and the LD between the index variant and all other variants in the locus. (c) presents marginal TWAS results (left panel) and meta-analysis TWAS results (right panel), with genes colored in blue and black to denote those not reported by GWAS and those reported by GWAS, respectively. (d) displays the FOCUS posterior inclusion probabilities (PIPs) for each gene at this locus. FOCUS, Fine-mapping Of CaUsal gene Sets; GWAS, genome-wide association studies; TWAS, transcriptome-wide association study