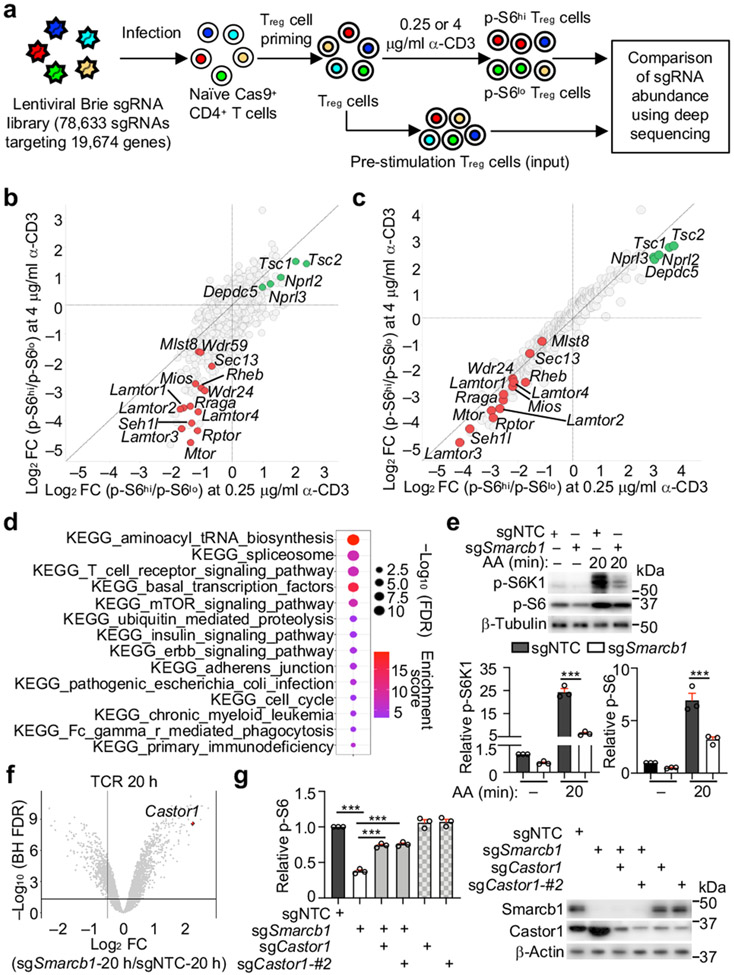
Figure 1. Genome-wide CRISPR screening uncovers mTORC1 regulatory networks in Treg cells.
(a) Genome-wide CRISPR screening approach. (b, c) Fold change (FC)/FC plot for primary (b) or secondary CRISPR screening (n = 6 sgRNAs per gene) (c). Positive (red) and negative (green) regulators. (d) Functional enrichment plot of genes validated by secondary CRISPR screening. (e) Immunoblot analysis and quantification of relative p-S6K1 and p-S6 in TCR-stimulated sgNTC- and sgSmarcb1-transduced cells after amino acid (AA) stimulation (n = 3 samples each group). (f) Gene expression profiles in sgNTC- or sgSmarcb1-transduced cells at 20 h of TCR stimulation (n = 4 samples each group). (g) Cells expressing indicated sgRNAs were stimulated with TCR for 3 h. Quantification of relative p-S6 level and immunoblot analysis of Smarcb1 and Castor1 expression (n = 3 samples each group). Mean ± s.e.m. (e, g). ***P < 0.001; one-way ANOVA (e, g). Data are representative of one (b–d, f) or two (g), or pooled from three (e) experiments.

