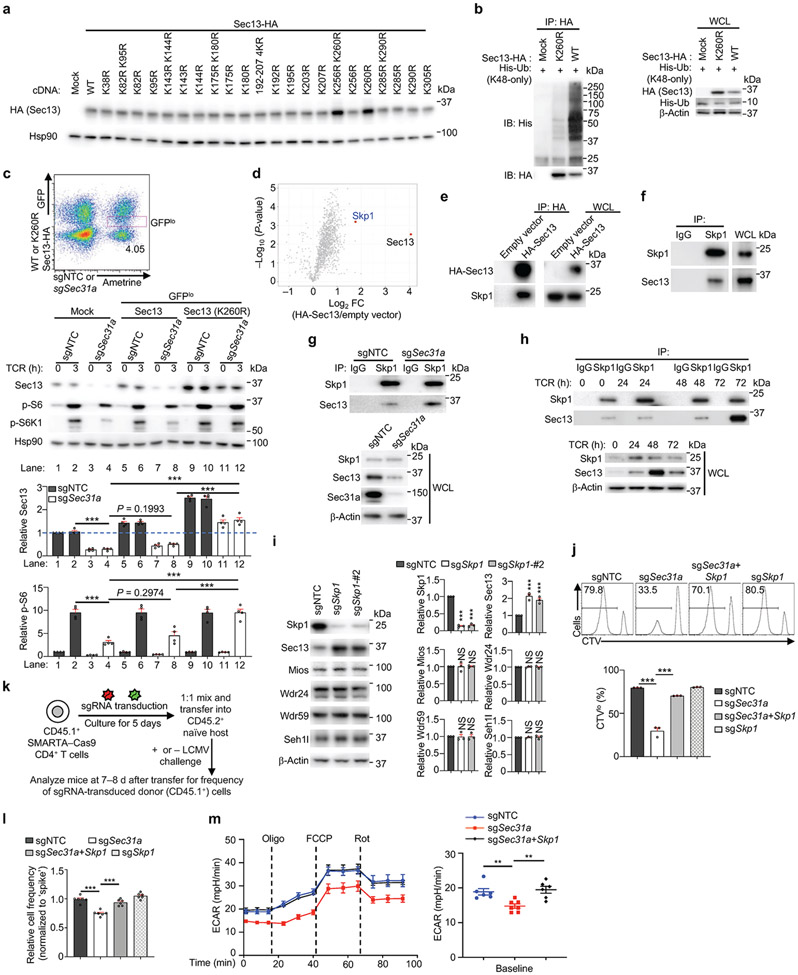
Extended Data Figure 7 (to Figure 3). Sec31a protects Sec13 from Skp1-mediated proteasomal degradation and supports T cell functional fitness.
(a) HA-tagged WT or the indicated lysine mutant constructs of Sec13 were transfected into HEK293T cells individually. Immunoblot analysis of HA and Hsp90. (b) HA-tagged WT or K260R mutant Sec13 was transfected into HEK293T cells together with the K48-only His-Ub followed by MG132 treatment and anti-HA immunoprecipitation (IP). Immunoblot analysis for HA, His-Ub and β-Actin. WCL, whole cell lysate. (c) Cas9-expressing CD4+ T cells were transduced with sgNTC or sgSec31a retrovirus (Ametrine+) together with WT or K260R mutant Sec13-expressing retrovirus (GFP+). Ametrine+GFPlo cells (see gating on flow cytometry plot, upper) were stimulated with TCR for 0 or 3 h. Immunoblot analysis and quantification of relative Sec13 and p-S6 levels (n = 4 samples each group). (d) Volcano plot of proteins, including Skp1, that interact with HA-Sec13 in induced Treg cells as identified by mass spectrometry (n = 3 samples each group). (e) Induced Treg cells transduced with HA-tagged-Sec13- or empty vector-expressing retrovirus were lysed with CHAPS buffer followed by α-HA immunoprecipitation (IP) and immunoblot analysis of HA and Skp1. (f) Induced Treg cells were lysed with CHAPS buffer followed by immunoprecipitation of endogenous Skp1 and immunoblot analysis of Skp1 and Sec13. (g) Interaction of endogenous Skp1 with Sec13 in sgNTC- or sgSec31a-transduced cells. (h) Naïve CD4+ T cells were stimulated with α-CD3/CD28 antibodies for 0, 24, 48 or 72 h. Immunoblot analysis of anti-Skp1 immunoprecipitants and WCL for Skp1, Sec13, and β-Actin (n = 2 samples per group). (i) Immunoblot analysis and quantification of relative expression of indicated proteins in sgNTC- or sgSkp1 (both Ametrine+)-transduced cells (n = 3 samples per group). (j) Indicated sgRNA-transduced cells were labelled with CellTrace Violet (CTV), and stimulated with α-CD3/CD28 antibodies for 72 h, followed by flow cytometry analysis and quantification of CTV dilution (n = 3 samples each group). (k) Diagram of SMARTA T cell transfer and LCMV infection system. Briefly, SMARTA–Cas9 CD4+ T cells (CD45.1+) transduced with sgRNA for candidate genes (CD45.1+Ametrine+) and mixed with sgNTC (CD45.1+mCherry+; ‘spike’)-transduced cells at a 1:1 ratio, and adoptively transferred into naïve (unchallenged; CD45.2+) mice that were left uninfected (see l) or challenged with LCMV infection (see Fig. 3f). (l) Quantification of the relative proportion (normalized to ‘spike’) of donor-derived (CD45.1+) T cells in the spleen of uninfected mice at 7 d after transfer (n =6 mice per group). (m) Cells transduced with sgNTC (Ametrine+), sgSec31a (Ametrine+) or sgSec31a-Skp1 (GFP+ and Ametrine+) were sorted and stimulated with α-CD3/CD28 antibodies for 20 h (n = 6-7 samples per group), followed by the measurement of extracellular acidification rate (ECAR). Oligo, oligomycin; FCCP, fluoro-carbonyl cyanide phenylhydrazone; Rot, rotenone. Mean ± s.e.m. (c, i, j, l, m). **P < 0.01; ***P < 0.001; one-way ANOVA (c, i, j, l, m, right); two-way ANOVA (m, left). Data are representative of one (d, j, l, m) or two (a, b, e–h), or pooled from two (c) or three (i) experiments.

