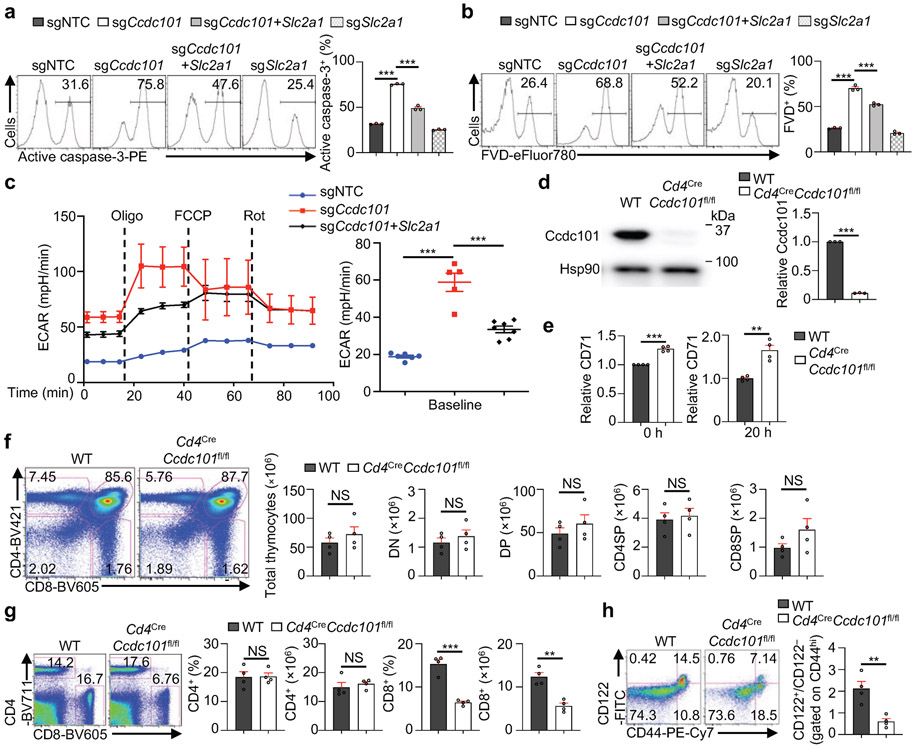
Extended Data Figure 10 (to Figure 4). SAGA complex prevents mTORC1 hyperactivation to enforce immune homeostasis in vivo.
(a, b) Induced Treg cells transduced with indicated sgRNAs were stimulated with α-CD3/CD28 antibodies for 20 h (n = 3 samples each group). Flow cytometry analysis and quantification of staining with active caspase-3 (a) and fixable viability dye (FVD, b) (n = 3 per group). (c) Cells transduced with indicated sgRNAs were stimulated with α-CD3/CD28 antibodies for 20 h (n = 5–7 samples per group), followed by the measurement of extracellular acidification rate (ECAR). Oligo, oligomycin; FCCP, fluoro-carbonyl cyanide phenylhydrazone; Rot, rotenone. (d) Immunoblot analysis and quantification of Ccdc101 expression in naïve CD4+ T cells from WT and Cd4CreCcdc101fl/fl mice (n = 3 mice per group). (e) Quantification of CD71 expression on naïve or activated WT and Ccdc101-deficient CD4+ T cells. Naïve CD4+ T cells among freshly isolated splenocytes from WT and Cd4CreCcdc101fl/fl mice (n = 4 mice per group) were gated (indicated as 0 h), or naïve CD4+ T cells were stimulated with α-CD3/CD28 antibodies for 20 h. (f) Flow cytometry analysis and quantification of numbers of total, double-negative (DN), double-positive (DP), CD4 single-positive (CD4SP), and CD8 single-positive (CD8SP) thymocytes from WT and Cd4CreCcdc101fl/fl mice (n = 4 mice each group). (g) Flow cytometry analysis and quantification of proportions and numbers of splenic CD4+ and CD8+ T cells from WT and Cd4CreCcdc101fl/fl mice (n = 4 mice each group). (h) Flow cytometry analysis and normalized ratio of CD122+ versus CD122− cells among CD44hi populations (gated on splenic CD8+ T cells) from indicated mice (n = 4 mice each group). Mean ± s.e.m. (a–h). NS, not significant; **P < 0.01; ***P < 0.001; two-tailed unpaired Student’s t-test (d–h); one-way ANOVA (a, b, c, right); two-way ANOVA (c, left). Data are representative of one (c) or two (a, b), or pooled from three (d–h) experiments.

