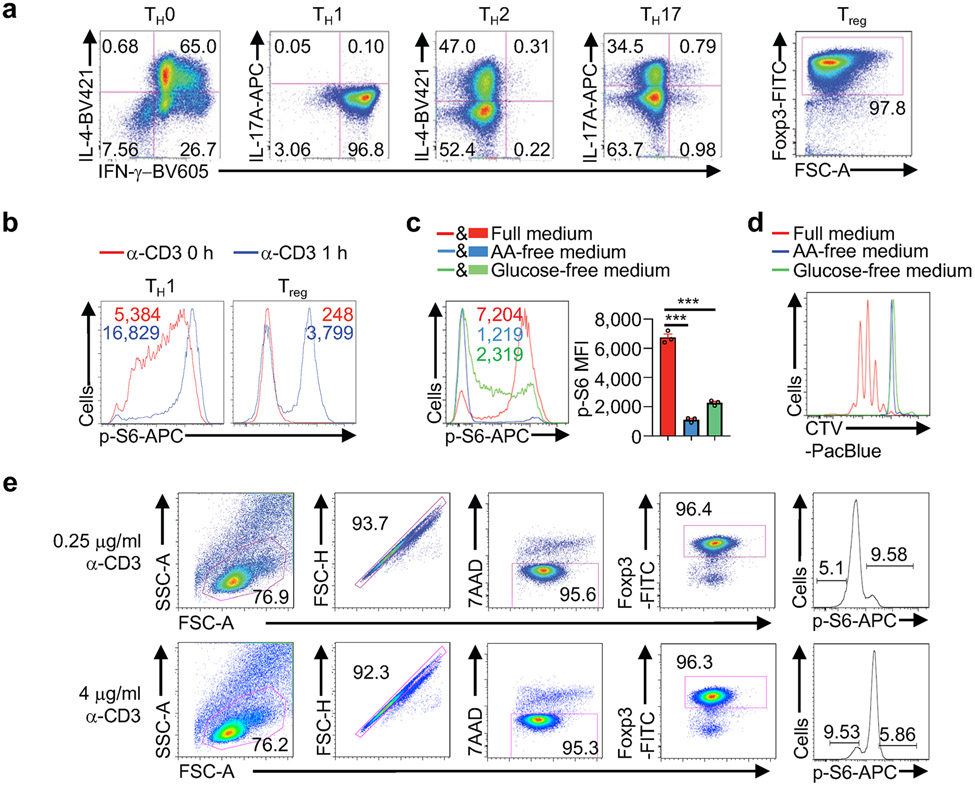
Extended Data Figure 1 (to Figure 1). Two rounds of pooled CRISPR screening to identify novel regulators of nutrient and mTORC1 signaling.
(a) Flow cytometry analysis of IFN-γ, IL-4, IL-17A or Foxp3 expression in cells cultured in TH0-, TH1-, TH2-, TH17- or induced Treg-polarizing condition (n = 3 samples each group). (b) Flow cytometry analysis of p-S6 in TH1 and Treg cells with TCR stimulation for 0 or 1 h (n = 3 samples each group). (c) Induced Treg cells were stimulated with α-CD3/CD28 antibodies in the presence or absence of amino acids (AA) or glucose for 3 h followed by flow cytometry analysis and quantification of p-S6 level [based on mean fluorescence intensity (MFI)] (n = 3 samples each group). (d) Induced Treg cells were labelled with CellTrace Violet (CTV) and stimulated with α-CD3/CD28 antibodies in the presence or absence of AA or glucose for 3 d, followed by flow cytometry analysis of CTV dilution (n = 3 samples each group). (e) Gating strategy used for sorting cells with the ≥ 10% highest (p-S6hi) and ≤ 10% lowest (p-S6lo) levels after stimulation with 0.25 or 4 μg/ml of α-CD3 antibody for 3 h (n = 2 samples each group). Mean ± s.e.m. (c). ***P < 0.001; one-way ANOVA (c). Data are representative of two (b–d) or three (a) experiments.

