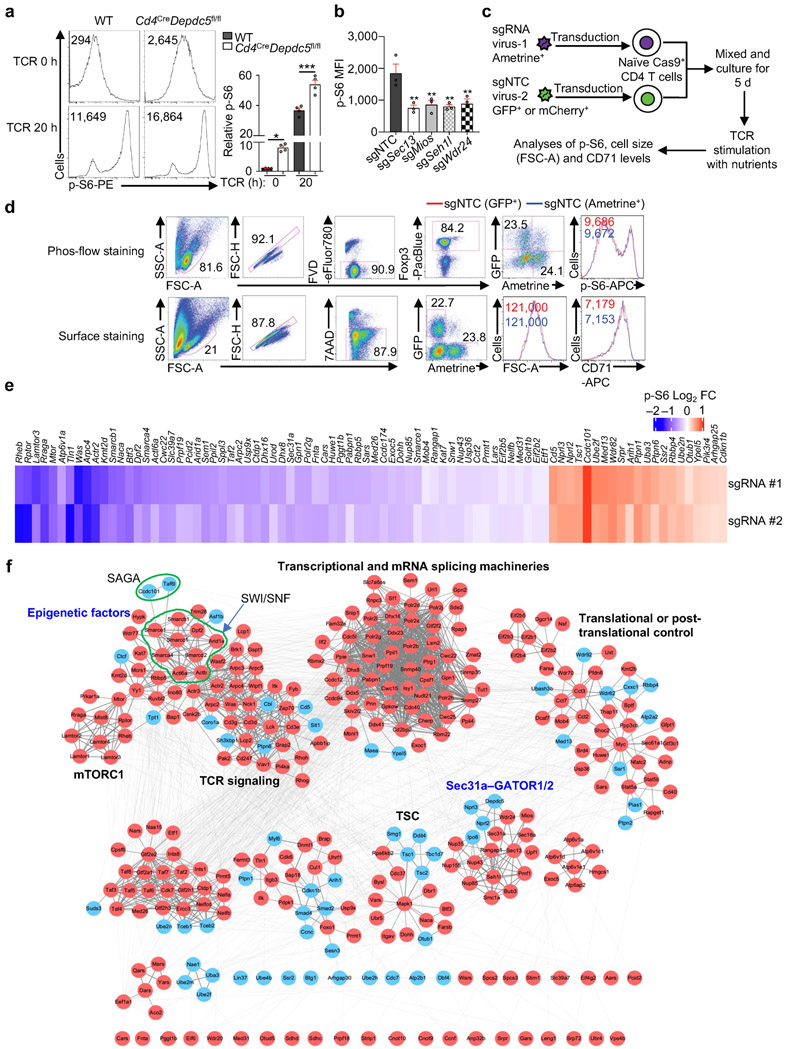
Extended Data Figure 2 (to Figure 1). Validation of individual candidate mTORC1 regulators.
(a) Flow cytometry analysis and quantification of p-S6 level [based on mean fluorescence intensity (MFI)] in naïve or activated WT and Depdc5-deficient CD4+Foxp3− T cells (n = 4 samples each group). Naïve CD4+ T cells among freshly isolated splenocytes from WT and Cd4CreDepdc5fl/fl mice were gated (indicated as TCR 0 h), or naïve CD4+ T cells were sorted and stimulated with α-CD3/CD28 antibodies overnight for flow cytometry analysis of p-S6 level. (b) Quantification of relative p-S6 level in induced Treg cells transduced with sgNTC, sgSec13, sgMios, sgSeh1l, or sgWdr24 (all Ametrine+) were stimulated with TCR for 3 h (n = 3 samples each group). (c) Diagram of dual-color co-culture system to examine cell-intrinsic effects of deletion of a candidate gene on TCR-induced p-S6, cell size and CD71 expression. Specifically, Cas9+ cells transduced with sgNTC (mCherry+ or GFP+; ‘spike’) were mixed with those transduced with those targeting a specific gene (Ametrine+), and stimulated with α-CD3 antibody for 3 h (for p-S6) or with α-CD3/CD28 antibodies for 20 h (for cell size and CD71). (d) Validation of dual-color co-culture system by using two sgNTC-expressing vectors with different fluorophores. Cells transduced with sgNTC (GFP+; ‘spike’) were mixed with those transduced with sgNTC (Ametrine+), and stimulated with α-CD3 antibody for 3 h to examine p-S6 (see phos-flow staining), or stimulated with α-CD3/CD28 antibodies for 20 h (n = 3 samples each group) to measure cell size and CD71 expression (see surface staining). (e) Heatmap summary of log2 FC (p-S6hi/p-S6lo) for individually validated candidate genes (63 positive and 21 negative regulators) including positive (Rheb, Rptor, Lamtor3, Rraga and Mtor) and negative (Cd5, Nprl3, Nprl2 and Tsc1) control genes (2 sgRNAs for each candidate). Specifically, Cas9-expressing CD4+ T cells transduced with sgRNA for target genes (Ametrine+) or non-targeting control sgRNA (sgNTC) (mCherry+; ‘spike’) were mixed and differentiated into induced Treg cells. These cells were then stimulated with α-CD3 antibody for 3 h (n = 3 samples each group). Relative p-S6 level (normalized to ‘spike’) was analyzed by flow cytometry. (f) Analysis of protein–protein interaction (PPI) networks of high-confidence regulators. Specifically, 286 positive and 60 negative high-confidence hits were integrated with the composite PPI databases that encompass STRING, BioPlex and InWeb_IM databases for the inference of functional modules. Red and blue circles represent genes whose deletion represses and promotes mTORC1 activity, respectively. Mean ± s.e.m. (a, b). *P < 0.05; **P < 0.01; ***P < 0.001; one-way ANOVA (a, b). Data are representative of one (f) or three (d, e), or pooled from two (a) or three (b) experiments.

