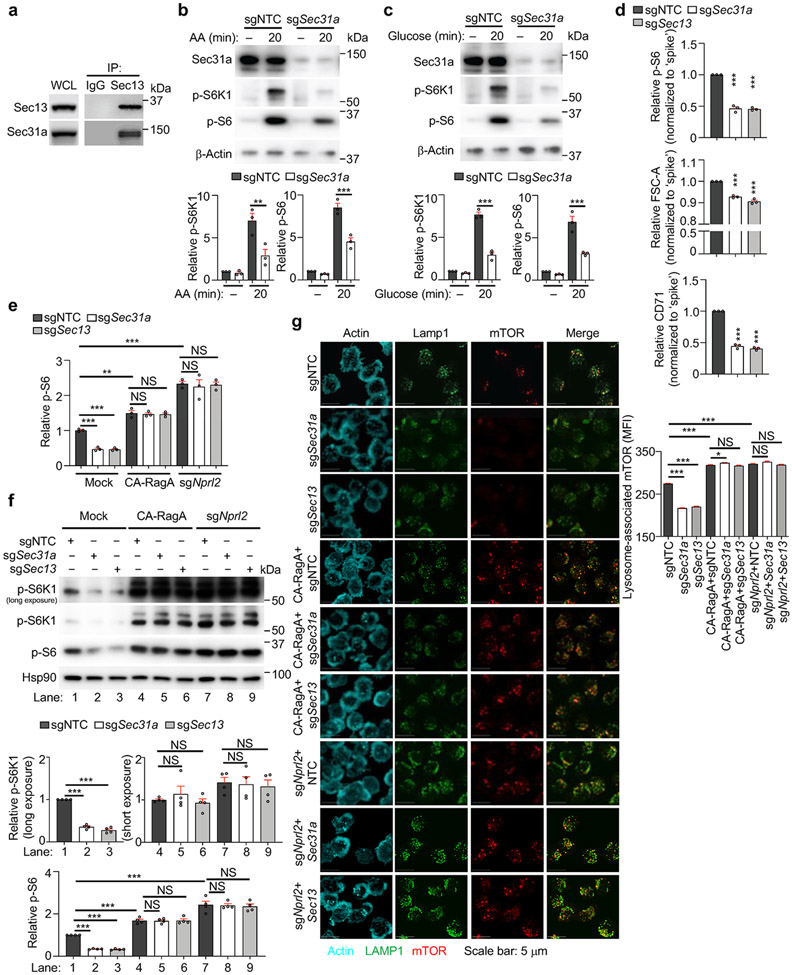
Extended Data Figure 4 (to Figure 2). Sec31a is required for mTORC1 activation.
(a) Interaction of endogenous Sec13 with Sec31a in induced Treg cells as assessed by immunoprecipitation (IP)–immunoblot analysis. (b, c) sgNTC- or sgSec31a-transduced cells were starved of and refed amino acids (AA, b) or glucose (c) for 20 min, followed by immunoblot analysis of Sec31a, p-S6K1, p-S6 and β-Actin. Lower, quantification of relative p-S6K1 and p-S6 levels (n = 3 samples each group). (d) Cells transduced with the indicated sgRNAs (all Ametrine+) were mixed with sgNTC (mCherry+; ‘spike’)-transduced cells, and stimulated with α-CD3 antibody for 3 h to measure p-S6 level or with α-CD3/CD28 antibodies for 20 h to measure cell size (FSC-A) and CD71 expression by flow cytometry (normalized to ‘spike’) (n = 3 samples each group). (e–g) sgNTC-, sgSec31a- or sgSec13 (all Ametrine+)-transduced cells were co-transduced with constitutively active RagAQ66L (CA-RagA)-expressing retrovirus (GFP+) or sgNprl2 (GFP+), followed by stimulated with TCR for 3 h to examine relative p-S6 level by flow cytometry (n = 3 samples each group) (e), p-S6K1 and p-S6 levels by immunoblot analysis (n = 4 samples each group) (f), or lysosomal localization of mTOR [based on mean fluorescence intensity (MFI)] (n > 700 cells per condition) (g). In f, two different exposures for p-S6K1 were included to account for the differential intensities between mock and CA-RagA or sgNprl2 conditions, and relative p-S6K1 level was quantified from long exposure for mock and short exposure for CA-RagA or sgNprl2 conditions (middle). Lower, quantification of p-S6 level. Mean ± s.e.m. (b–g). NS, not significant; **P < 0.01; ***P < 0.001; one-way ANOVA (b–g). Data are representative of two (e–g) or four (a), or pooled from three (b–d) experiments.

