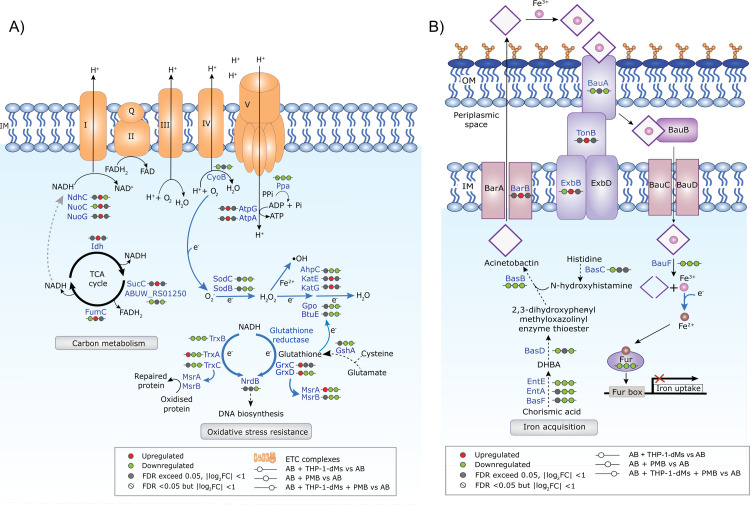
Fig 2. A. baumannii differentially remodels oxidative stress resistance and iron homeostasis following different treatments.
Schematic diagram illustrating protein networks in AB5075 associated with A) carbon metabolism and oxidative stress resistance, and B) acinetobactin biosynthesis and iron acquisition. Red and green indicate upregulated and downregulated differentially expressed proteins, respectively. Data are presented as mean of three biological replicates per experimental group. IM, inner membrane; OM, outer membrane; ETC, electron transport chain; Gpo, glutathione peroxidase (ABUW_RS11455); GshA, glutamate—cysteine ligase (ABUW_RS00565); NrdB, ribonucleotide-diphosphate reductase subunit beta (ABUW_RS15470); DHBA, 2,3-dihydroxybenzoic acid; EntA, SDR family oxidoreductase (ABUW_RS10080).

