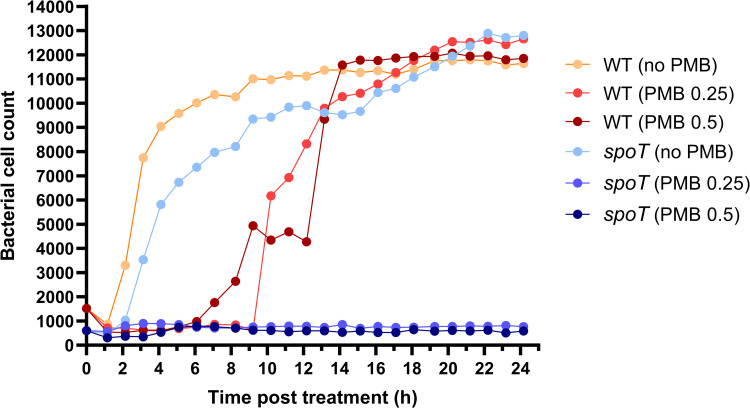
Fig 5. Time-lapse live-cell imaging reveals different growth kinetics of spoT mutant following polymyxin treatment.
ImageJ was employed for imaging analysis and cell count of AB5075 wild-type (WT) and spoT mutant following polymyxin B (PMB) treatment at 0.25 or 0.5 mg/L, and no treatment (i.e., controls).

