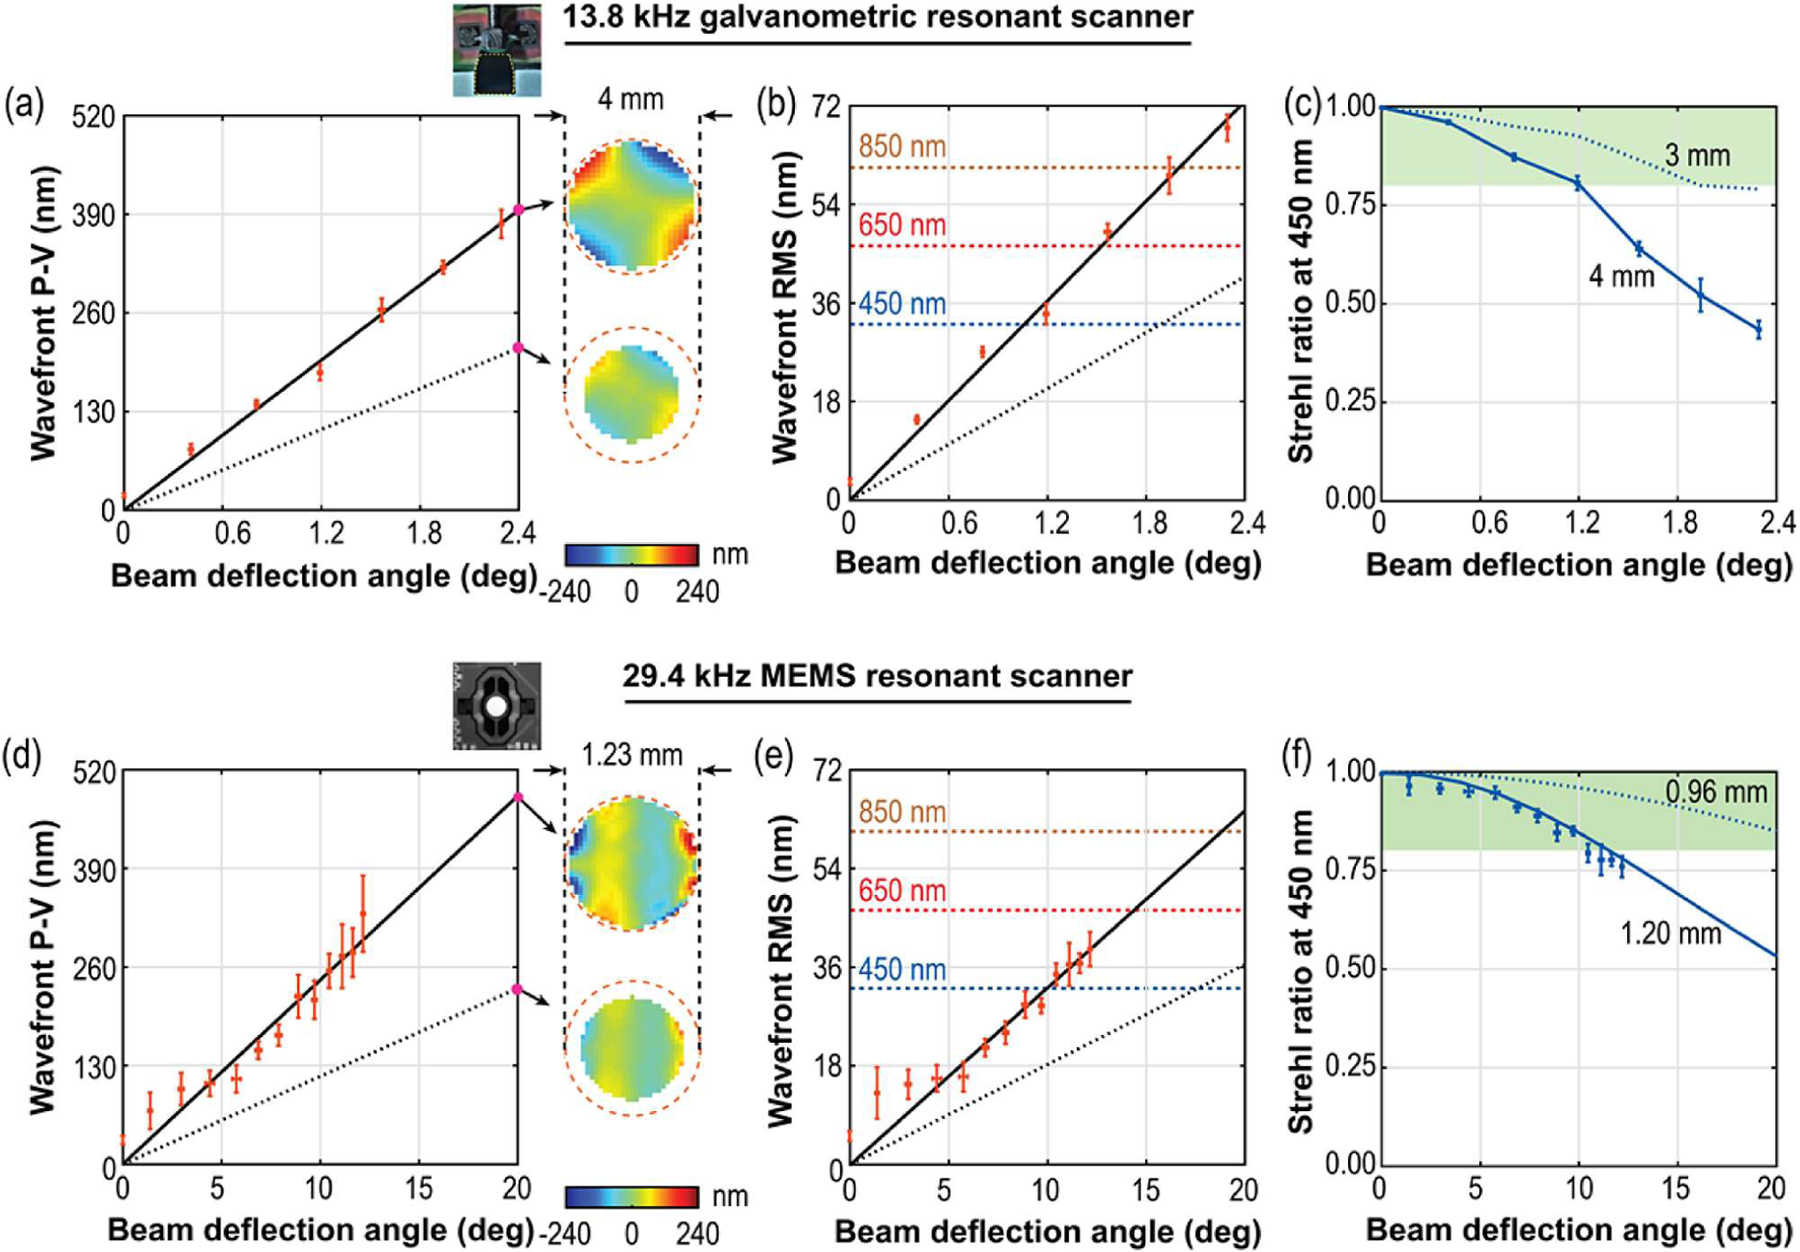
Fig. 6.

Comparison of wavefront P-V, wavefront RMS, and Strehl ratio (450 nm), when using two different pupil sizes at the resonant scanner mirrors: 4 (solid lines) and 3 mm (dotted lines) for the 13.8 kHz galvanometric resonant scanner; and similarly, 1.20 (solid lines) and 0.96 mm (dotted lines) for the 29.4 kHz MEMS resonant scanner. The dotted lines parallel to the x axis in (b) and (e) represent Maréchal diffraction-limited RMS for the wavelengths shown and the green shaded region in (c) and (f) satisfies diffraction-limited performance. The solid and dotted lines in (c) represent lines joining data points, and those in (f) represent fitted and extrapolated Strehl ratio values.
