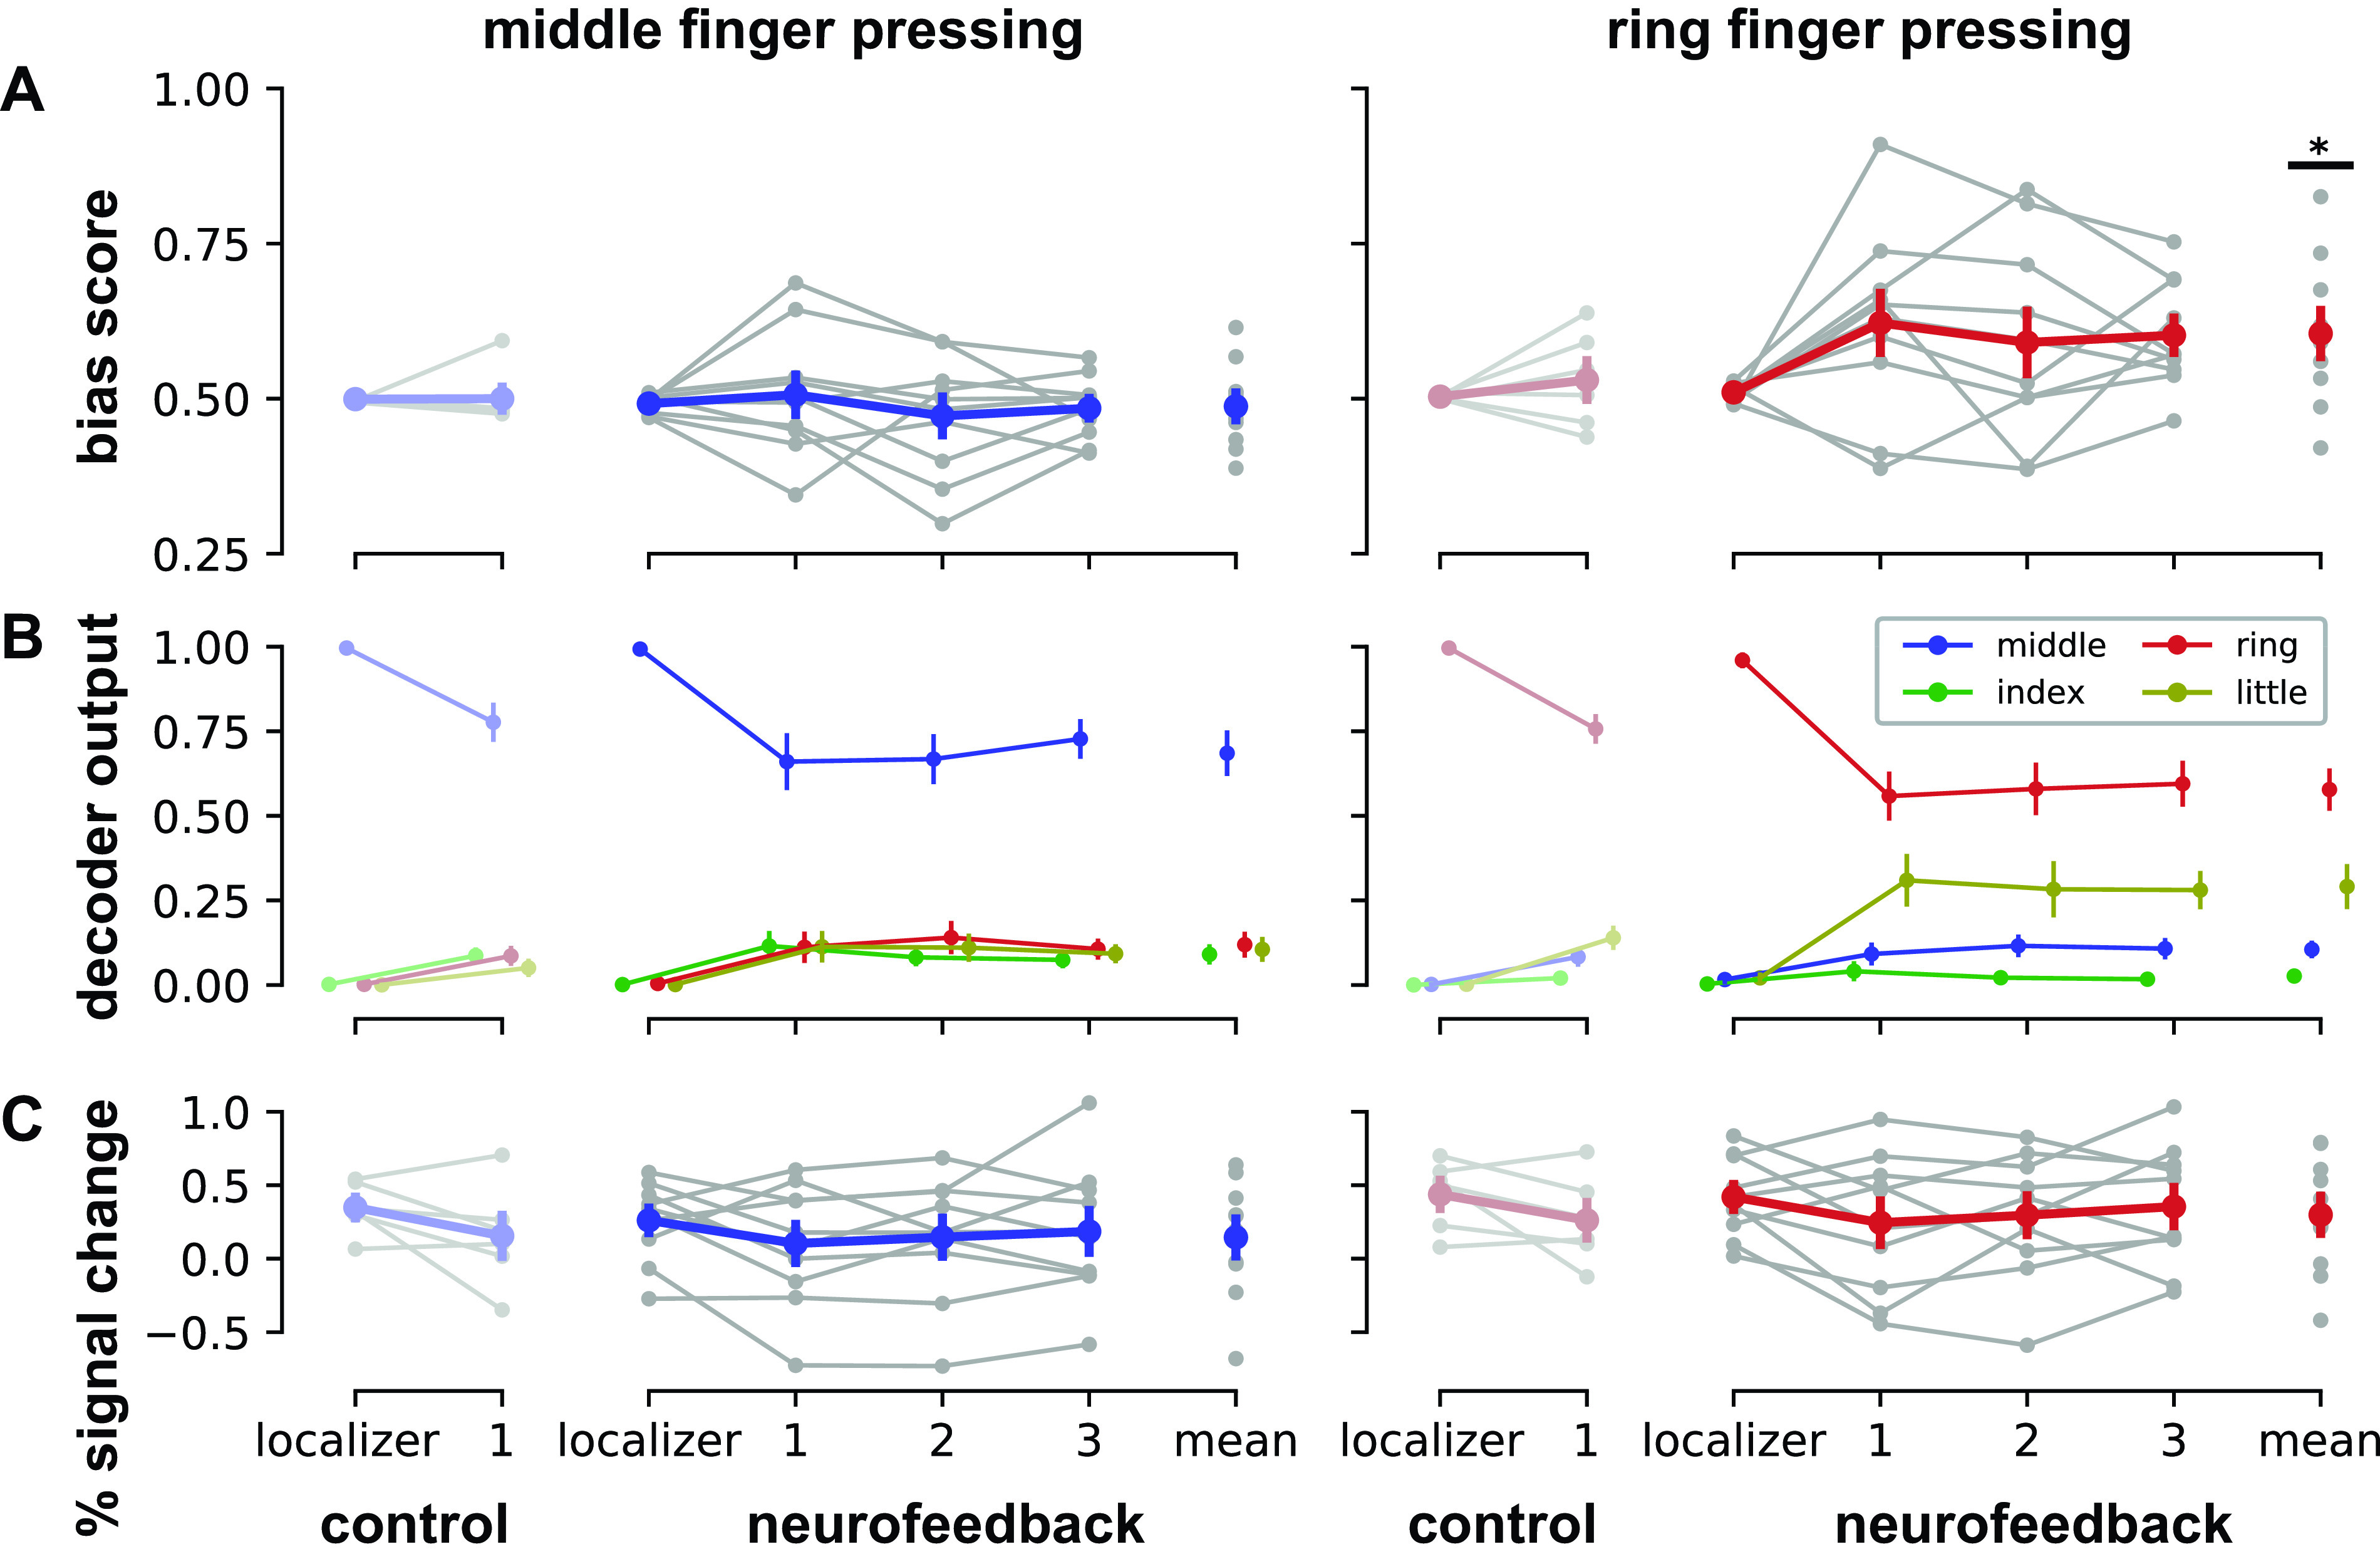
Figure 3.

Individual finger pattern bias modulation. A: mean bias scores by session for presses of middle finger (blue, left column) and ring finger (red, right column). See Eq. 1 in methods for bias score calculation details. B: mean decoder outputs by session. During middle finger presses, bias scores encouraged participants to increase the index finger decoder output (green) relative to the ring finger output (red). During ring finger presses, bias scores encouraged participants to increase the little finger output (yellow) relative to the middle finger output (blue). C: mean univariate activations by session, calculated as the mean percent signal change within the voxels selected by each decoder. Univariate activations were found to be unrelated to changes in bias score. Control data were acquired from participants (N = 6) who performed two sessions of finger pressing but did not receive neurofeedback in the second session (19). Neurofeedback data (N = 10) are shown by session (localizer: pattern localizer; 1–3: neurofeedback sessions; mean: average over all neurofeedback sessions). All data (control and neurofeedback) are shown relative to a decoder trained on each participant’s localizer session. Gray dots indicate means for each participant; colored dots indicate means across the entire group. Errors bars indicate SE. Statistical differences relative to the pattern localizer sessions are indicated at *P < 0.05.
