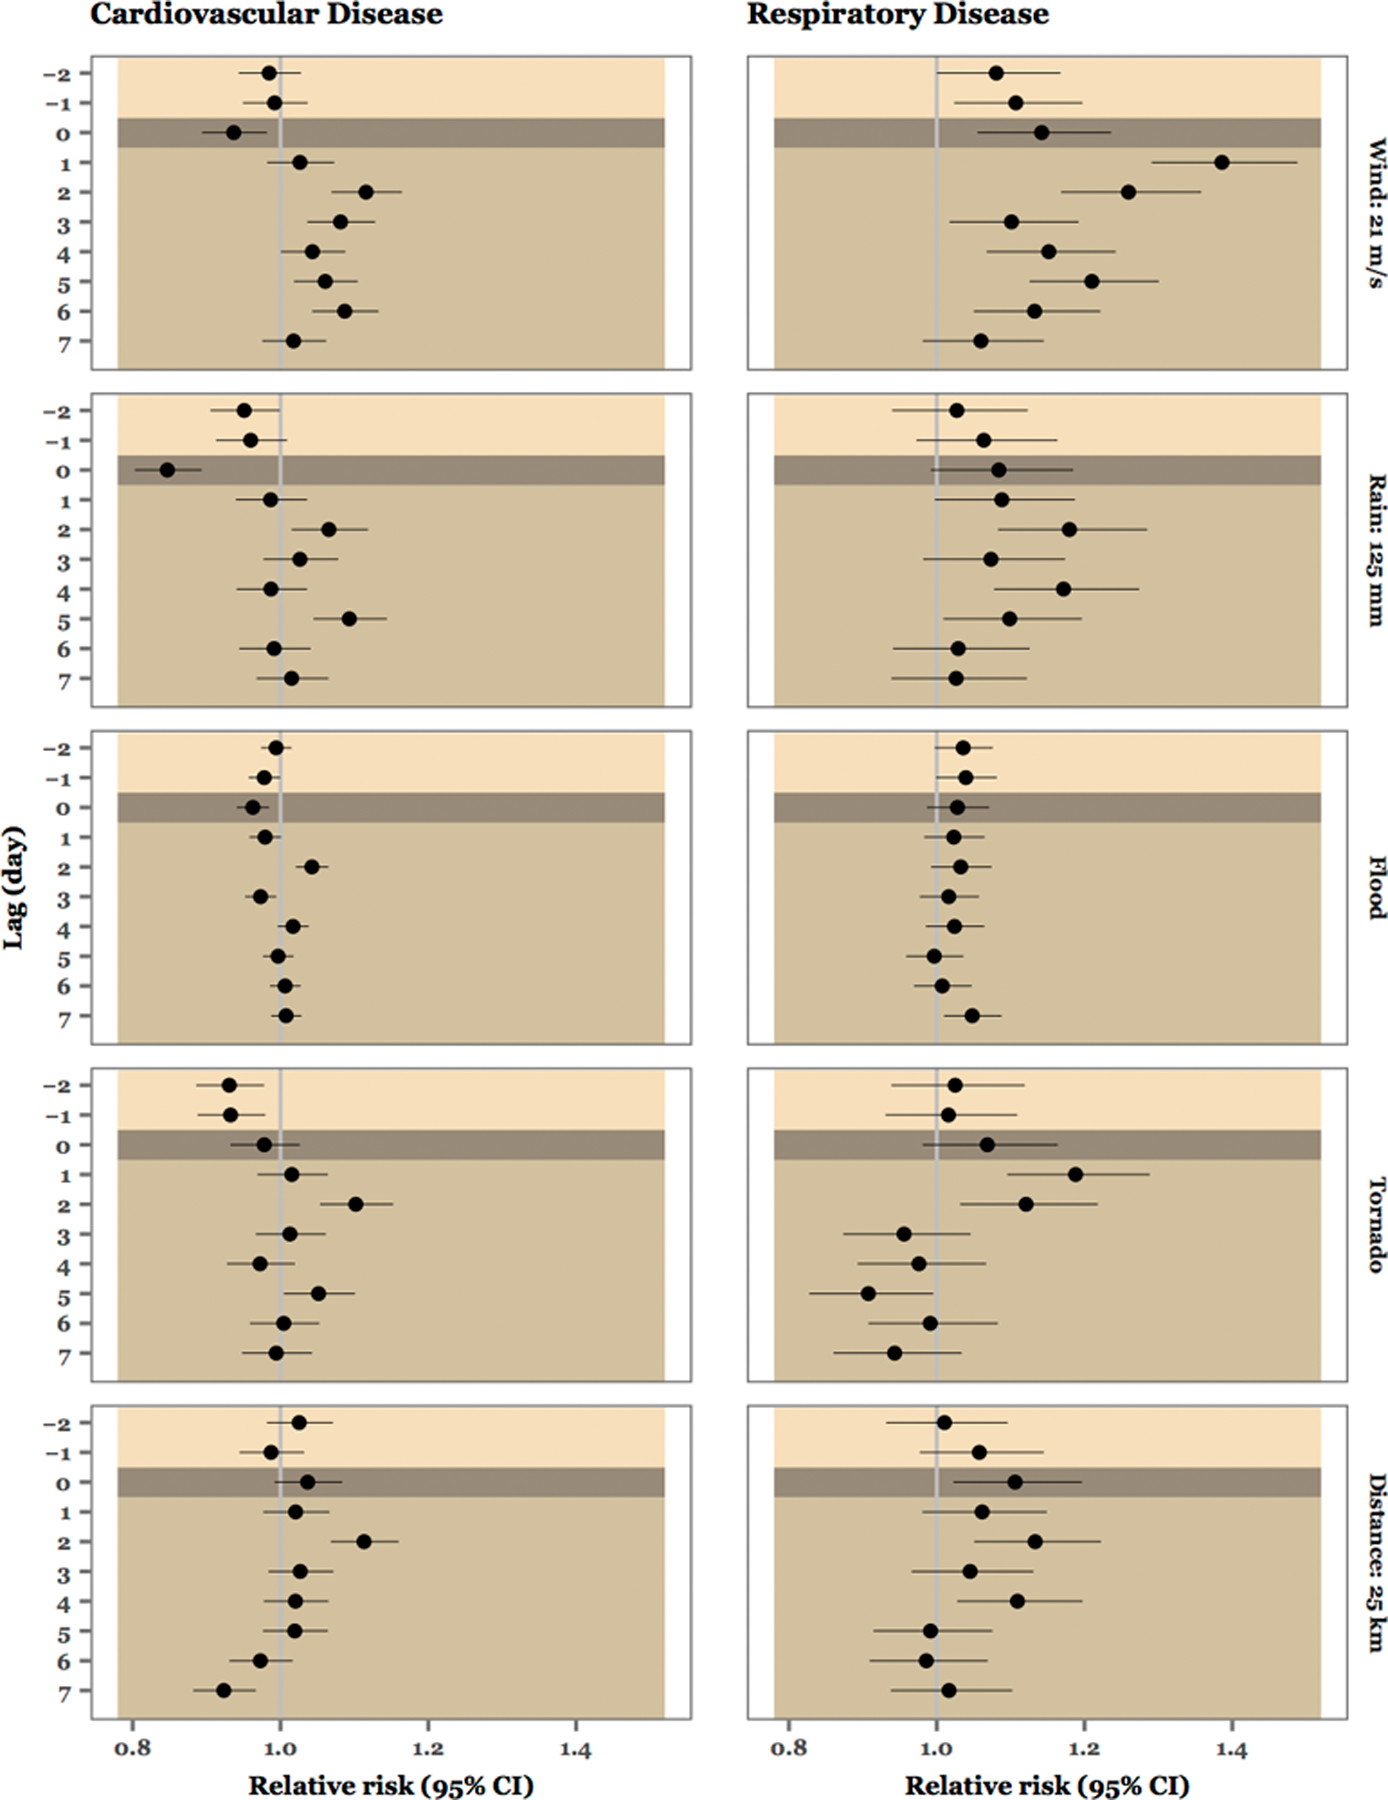
Figure 2:

Estimates of lag-specific relative risks of cardiovascular (left) and respiratory (right) hospitalizations on days during storm periods compared to matched unexposed days, for all storms and across all exposed counties, for each of the five exposure metrics considered (labeled on right). Circles show point estimates and horizontal lines show 95% confidence intervals. The gray vertical line shows as a reference a relative risk of 1 (i.e., no observed association between tropical cyclone exposure and hospitalization risk). Shading divides the lag period among pre-storm days (lightest shade), the day of the storm’s closest approach (darkest shade), and post-storm days (intermediate shade).
