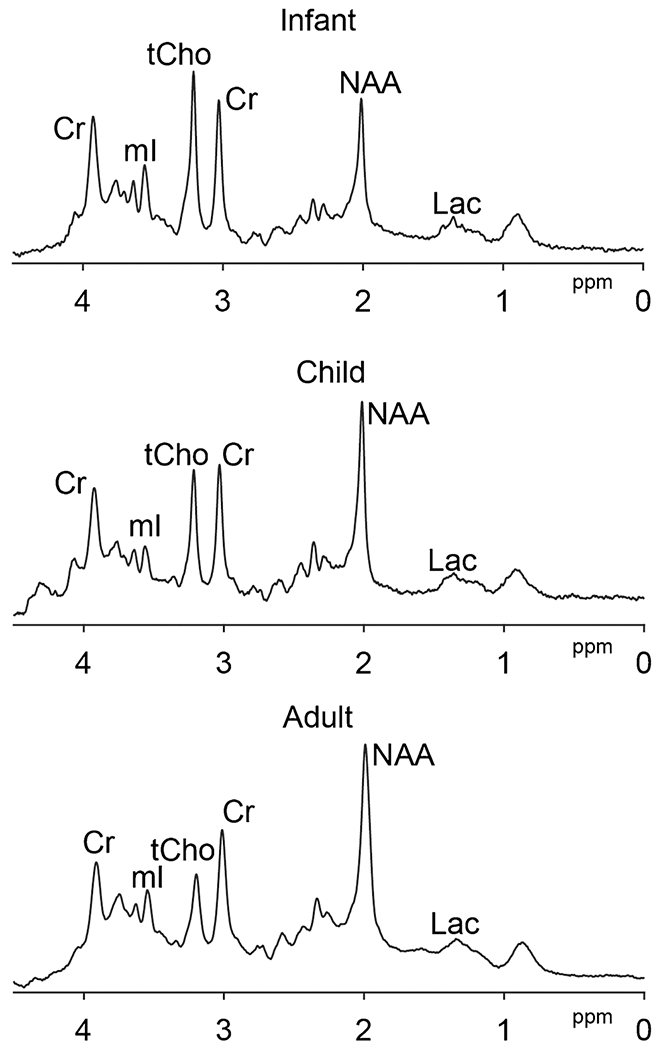
Fig. 2.

Age-related change of the proton MRS brain spectra at 3 T. Infant (GA at birth, 36w; scanned at 38 weeks 6 days; volume = 24 × 40 × 24mm3 in bilateral thalamus, TE = 35 ms, average = 64), child (4-year-old, volume = 17 × 40 × 17mm3 in bilateral thalamus, TE = 35 ms, average = 32), adult (24-year-old, volume = 30 × 30 × 30mm3 in posterior cingulate, TE = 35 ms, average =64) short-TE PRESS spectra with TR = 2 s are shown, respectively. Spectra are normalized to the Cr signal amplitude. tCho, NAA, and Lac levels can be seen to change with age, as does the linewidth
