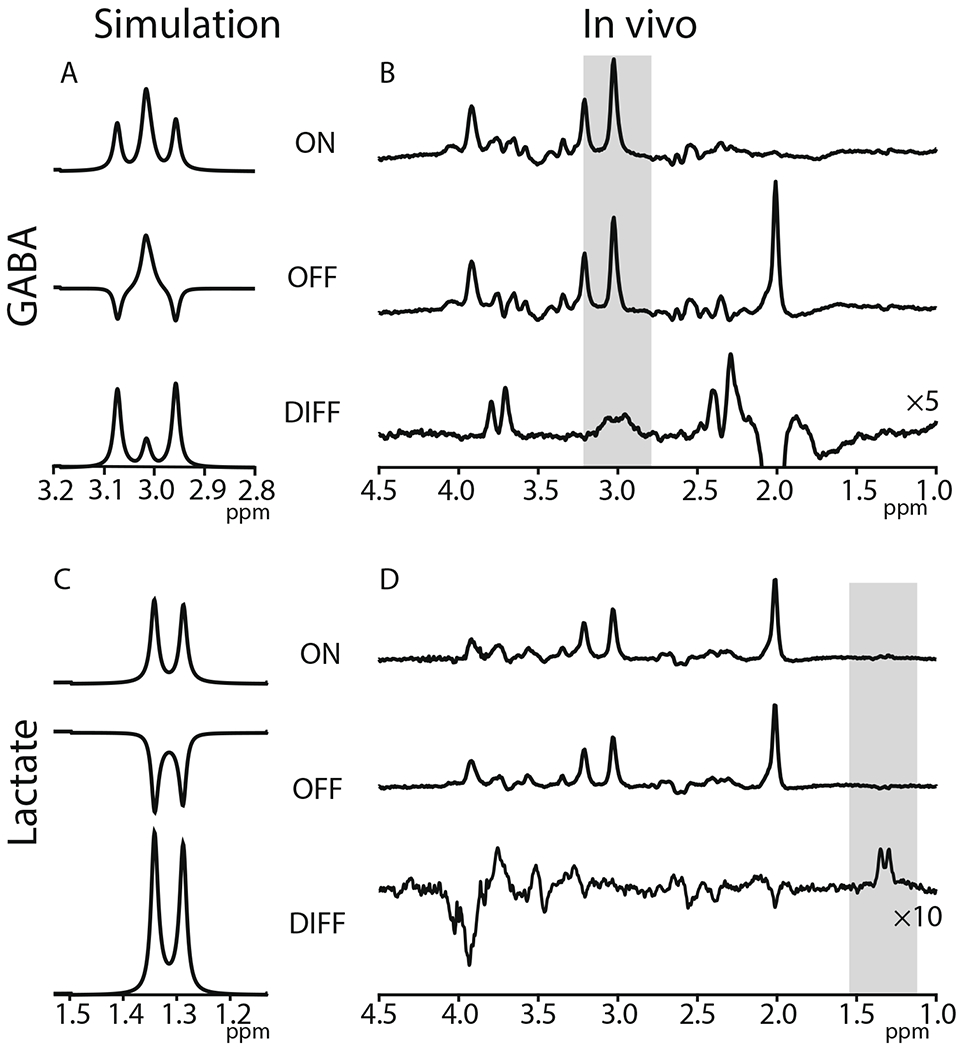
Fig. 4.

J-difference editing of GABA and lactate. GABA-edited spectra in simulation (A) and in vivo (B). The shaded region marks the edited GABA signal at 3 ppm. Lac-edited spectra in simulation (C) and in vivo (D). The shaded region marks the edited Lac signal at 1.3 ppm. Simulation sequence parameter: GABA: TE = 80 ms, field strength = 3 T; Lac: TE = 140 ms, field strength = 3 T. In vivo sequence parameter: GABA: TR = 2 s, TE = 80 ms, field strength = 3 T, averages = 320, acquisition bandwidth = 2000 Hz, acquisition time: 10 min 40 s; Lac: TR = 2 s, TE = 140 ms, field strength = 3 T, averages = 320, acquisition bandwidth = 2000 Hz, acquisition time: 10 min 40 s
