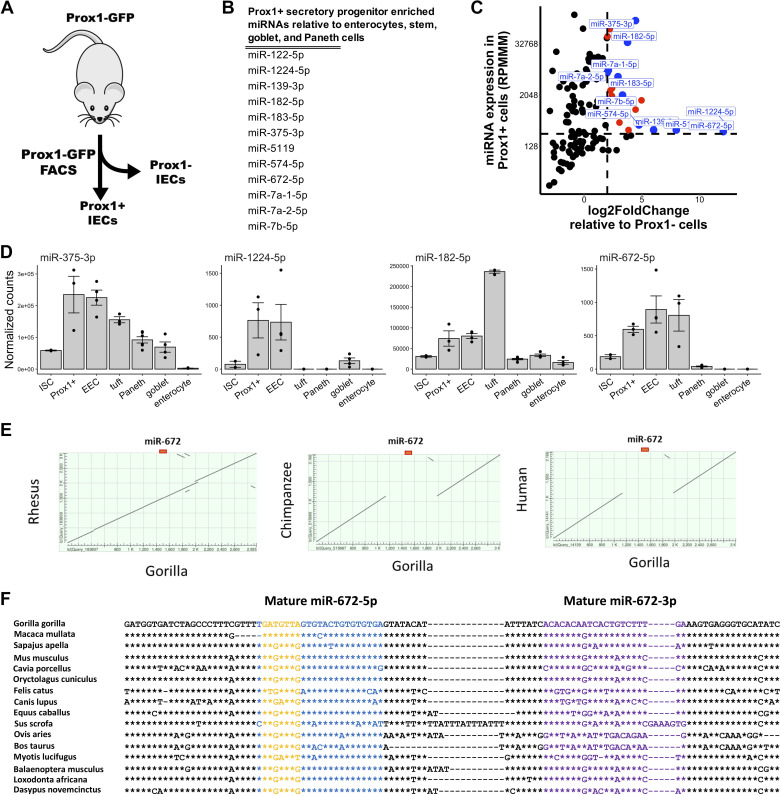
Figure 4.
miR-1224 and miR-672 are Prox1+ secretory progenitor cell enriched microRNAs. A: schematic of experimental plan for analysis of Prox1+ small intestinal secretory progenitor cells. Prox1+ and Prox1− cells were isolated from the jejunum of Prox1-GFP mice and subjected to small RNA-seq analysis. B: list of microRNAs enriched in jejunal Prox1+ secretory progenitor cells relative to stem cells, enterocytes, goblet cells, and Paneth cells (enteroendocrine and tuft cells not included since they are derived from Prox1+ secretory progenitors). MicroRNA enrichment is defined as an average expression > 500 and fold change > 1.5 versus each listed cell type. C: scatter plot of expression levels (reads per million mapped to microRNAs, RPMMM; y-axis) of microRNAs in isolated Prox1+ cells and log2-fold change (x-axis) of microRNA expression in Prox1+ cells relative to Prox1− cells. Prox1+ cell enriched microRNAs are depicted in orange and those with adjusted P value < 0.05 are depicted in blue. D: normalized expression of miR-375-3p, miR-1224-5p, miR-182-5p, and miR-672-5p across cell fractions enriched for ISCs, Prox1+ secretory progenitor cells, enteroendocrine cells (EECs), tuft cells, Paneth cells, goblet cells, and enterocytes. E: dot plot of the 3-kb locus centered on the miR-672 gene in the rhesus, chimpanzee, and human genomes relative to the gorilla genome. F: multiple DNA sequence alignment of the miR-672 gene in various placental mammalian species. The mature -5p, mature -3p, and seed sequences are depicted in blue, purple, and yellow, respectively. Position identities relative to gorilla are denoted with asterisks and gaps are denoted with hyphens. Error bars represent standard error.

