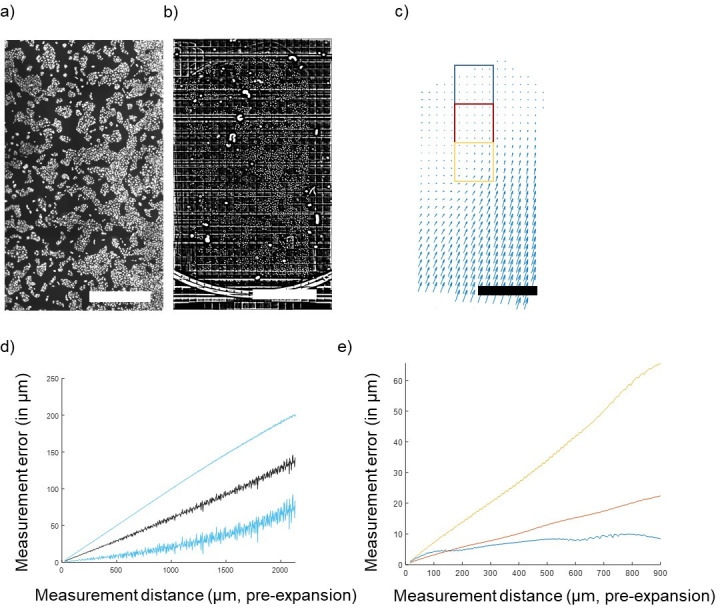
Author response image 1. Quantification of gel deformation over long distances.

(A) Cultured U2OS cells just after gelation and (B) after full expansion, with an FFT-based short pass filter applied to reduce variation in illumination across imaging fields. (C) Map of distortions across the entire gel. (D) Average measurement error across the entire gel (mean ± SD in blue) and (E) measurement error (mean) of 1,000-pixel square areas indicated by colored boxes in (C) at increasing distances away from the free gel edge. Scale bars: (A) 1 mm, (B) 10 mm (post-expansion), (C) 1 mm (pre-expansion).
