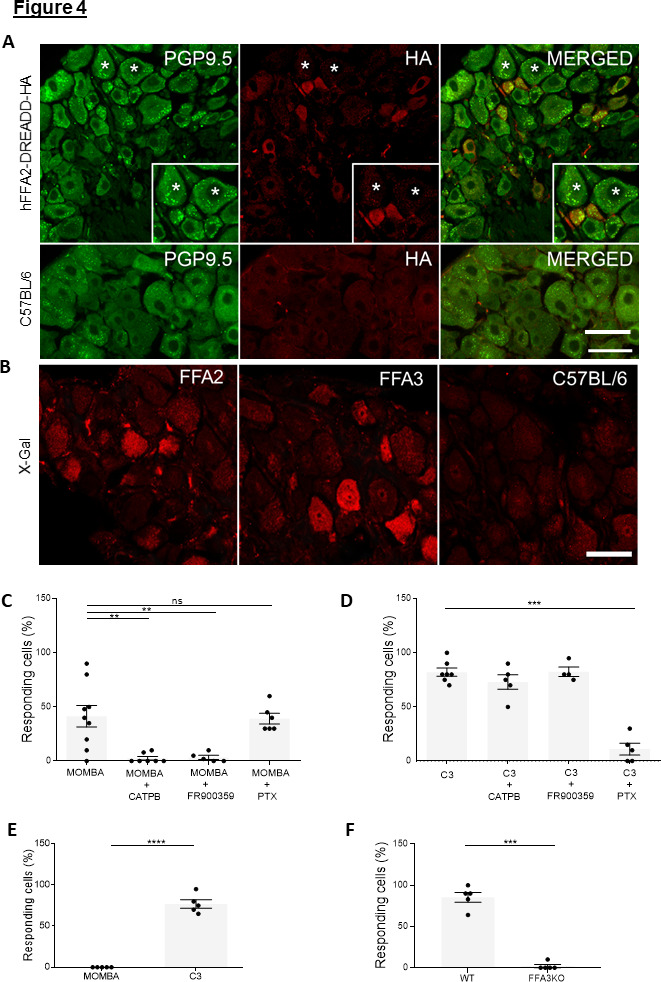
Figure 4. Both FFA2-DREADD-HA and FFA3 are expressed and functional in cells of dorsal root ganglia: the two G-protein-coupled receptors (GPCRs) elevate Ca2+ by different mechanisms (A).
Sections of dorsal root ganglia taken from hFFA2-DREADD-HA-expressing mice were immunostained with anti-PGP9.5 to identify neurons (left-hand panel, green) and with anti-HA to detect the receptor (middle panel, red). Merging of such images (right-hand panel) showed modest coexpression (see main text for quantification) but with additional anti-HA staining interspersed between neurons. Inserts: focus on regions in which individual cells express PGP9.5 but not HA (star), express HA reactivity but not PGP9.5 (chevron), or coexpress both PGP9.5 and hFFA2-DREADD-HA (double arrow). (B) Fluorescent X-gal staining (red) of dorsal root ganglia (DRG) sections isolated from mice expressing β-galactosidase reporter gene, which is driven either by the Ffar2 (left-hand panel) or Ffar3 gene promoters (middle panel). DRG sections from wild-type mice were also immunostained with X-gal (right-hand panel). Scale bar = 20 µm. (C, D) Single-cell Ca2+ imaging studies were performed on cells isolated from DRGs taken from hFFA2-DREADD-HA-expressing mice. Cells were exposed to 4-methoxy-3-methyl-benzoic acid (MOMBA) (C) or C3 (D). In various examples cells were pre-treated CATPB, with the Gq/G11 inhibitor FR900359 (15 min) or pertussis toxin (24 hr) prior to addition of agonist. CATPB blocked the effect of MOMBA (**p < 0.01) but not C3. FR900359 also blocked the effect of MOMBA (**p < 0.01) but not C3, whilst pertussis toxin treatment blocked the effect of C3 (***p < 0.001) but not MOMBA. One-way analysis of variance followed by Bonferroni’s Multiple Comparison Test. Pertussis toxin treatment blocked the effect of C3 (***p < 0.001) but not MOMBA. One-way analysis of variance followed by Bonferroni’s Multiple Comparison Test. (E) Cells dispersed from DRGs isolated from CRE-MINUS mice were used to assess the ability of ligands to elevate Ca2+. No effect of MOMBA was recorded whilst C3 was effective in most of the cells tested (****p <0.0001, unpaired t-test). (F) TUG-1907 (3 µM) was able to elevate Ca2+ levels in DRG cells from wild type but not FFA3-knockout mice (***p < 0.001, unpaired t-test).


