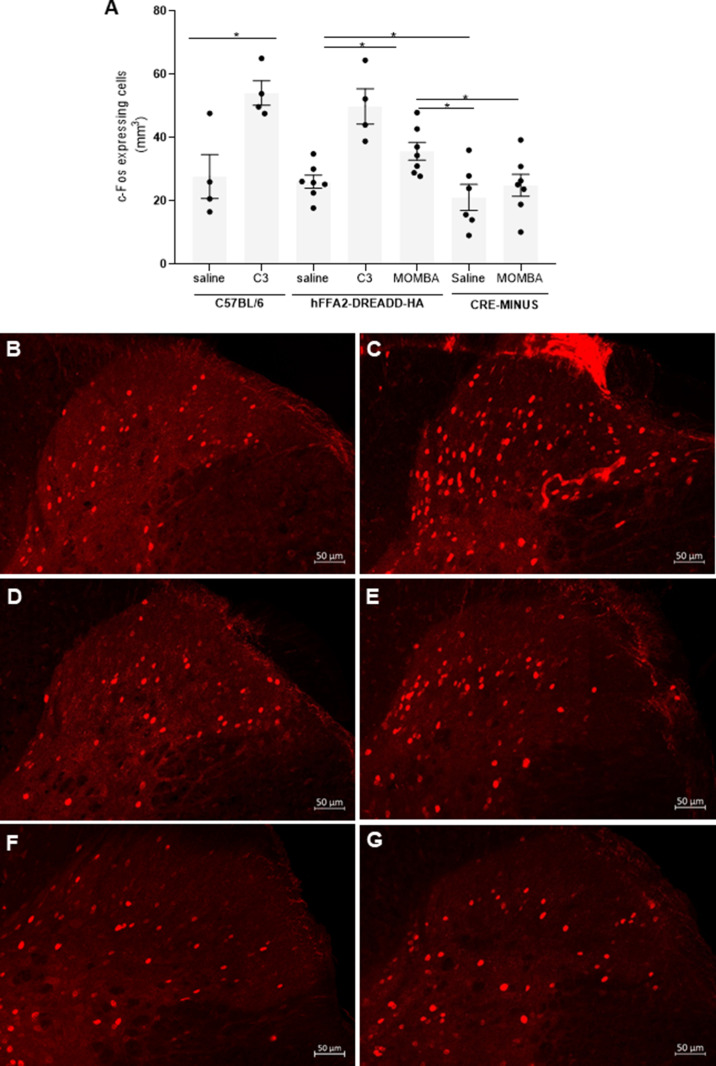
Figure 5. Gut short-chain fatty acid receptors promote activation of neurons in the dorsal horn of the spinal cord: roles for both FFA2 and FFA3 (A).
2 hr after introduction of saline, C3 or 4-methoxy-3-methyl-benzoic acid (MOMBA) into the colon of wild-type C57BL/6, hFFA2-DREADD-HA, or CRE-MINUS mice the number of c-Fos-expressing cells in the dorsal horn of the spinal cord was quantified. Data points represent individual animals. C3 increased c-Fos-expressing cells in wild-type (*p < 0.05) and hFFA2-DREADD-HA-expressing mice, MOMBA also did so in hFFA2-DREADD-HA expressing (*p < 0.05) but not CRE-MINUS mice (unpaired t-test). Representative images of dorsal horn from C57BL/6 plus saline (B), or plus C3 (C); hFFA2-DREADD-HA plus saline (D), or plus MOMBA (E); CRE-MINUS plus saline (F), or plus MOMBA (G) treatments are shown for illustration. Scale bar = 50 µm.


