. 2022 Feb 17;11:e71864. doi: 10.7554/eLife.71864

Figure 1. scRNAseq of distinct E12.5 forebrain regions from WT and Nes-dVenus mice.

(A) Coronal section through the LGE/MGE (left) and CGE (right) of a E12.5 Nes-dVenus telencephalon immunostained for GFP (green), Nestin (Red) and Dcx (Blue). Scale bar = 200 μm. (B) Schematic of telencephalic cell dissection and single-cell dissociation. (C) Uniform manifold approximation and projection (UMAP) plots of all cells labeled by brain region (left), mouse line (middle) or putative cell clusters (right). (D) Representative genes displaying enriched temporal and/or spatial expression patterns. CTX, cortex; LGE, lateral ganglionic eminence; MGE, medial ganglionic eminence; CGE, caudal ganglionic eminence; WT, wild-type.

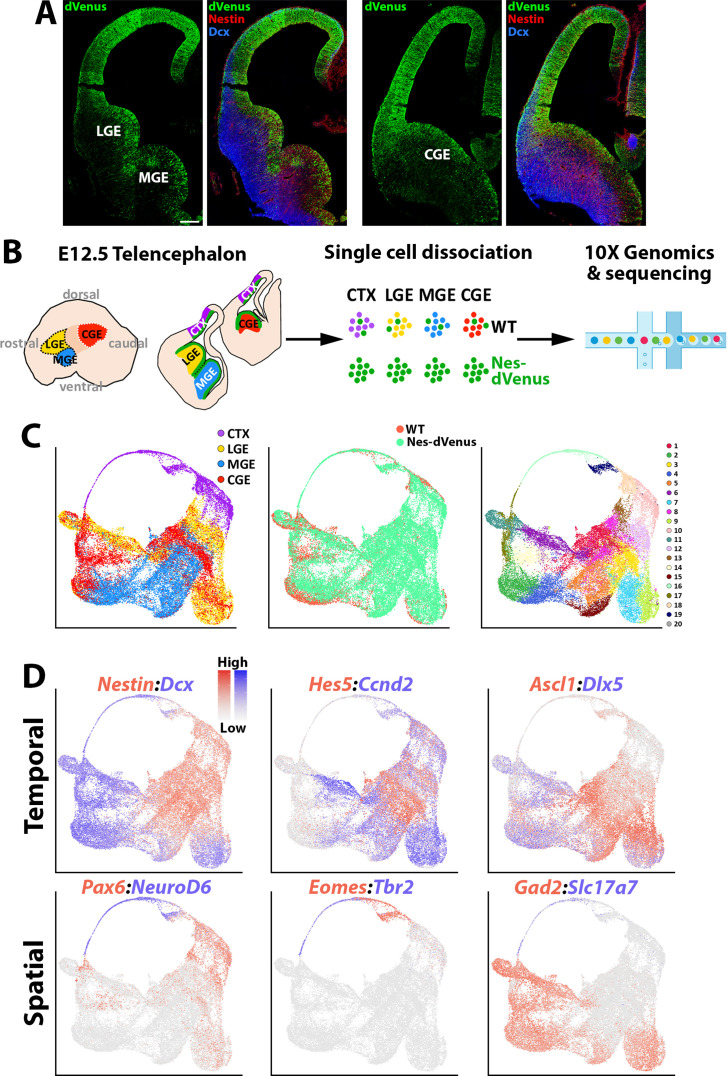
Figure 1.

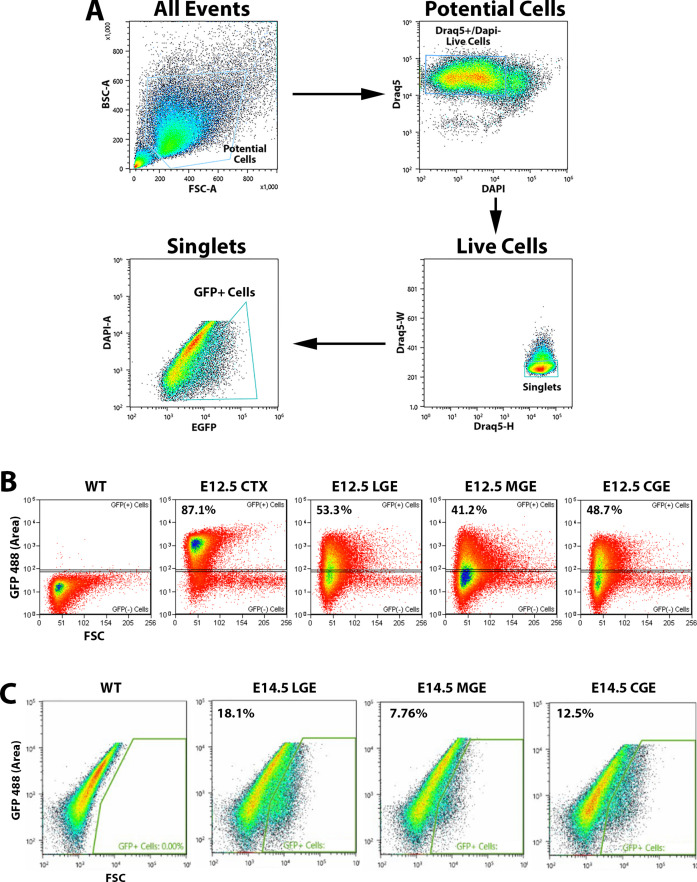
Figure 1—figure supplement 1. Flow cytometry plots depicting isolation of GFP-positive cells in Nes-dVenus mice.

Figure 1—figure supplement 1.

(A) Flow cytometry gating strategy: gated for potential live cells, then gated for DRAQ5+/DAPI- live cells, then gated by DRAQ5 width vs. height to select singlets, then EGFP vs. DAPI to collect GFP+ live cells. (B) FACS plots depicting GFP-positive cells collected from the CTX, LGE, MGE, and CGE in E12.5 Nes-dVenus mice. (C) FACS plots depicting GFP-positive cells collected from the LGE, MGE, and CGE in E14.5 Nes-dVenus mice.
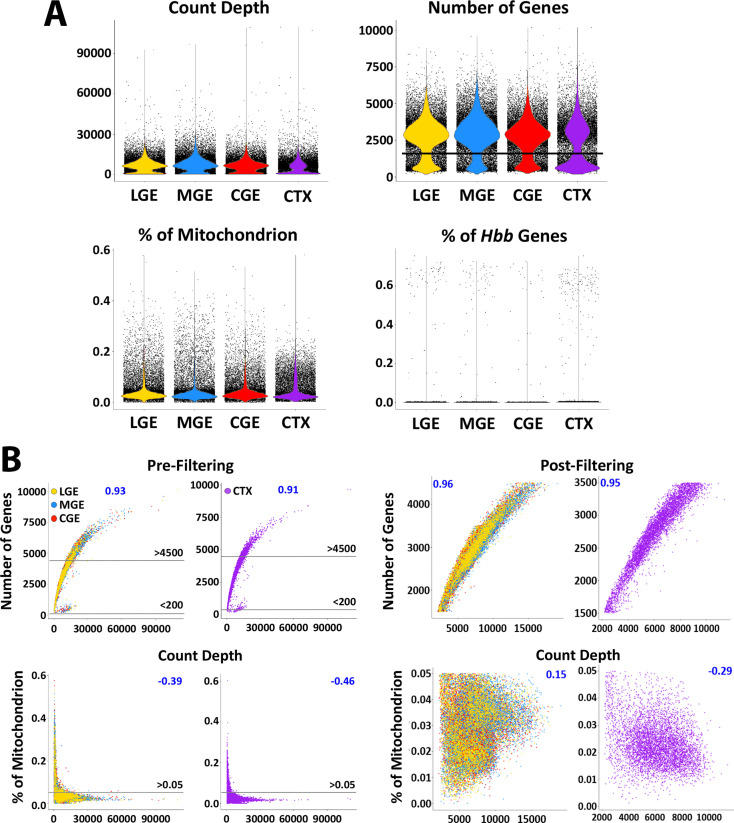
Figure 1—figure supplement 2. Quality-control of sequenced cells.

Figure 1—figure supplement 2.

(A) Cells that had unique feature counts < 4500 or > 1500 were filtered out using Seurat (black horizontal line in top right plot approximates 1500 gene/cell cutoff). Mitochondrial counts over 0.05% and Hbb gene counts over 0.01% were also filtered out. (B) Scatterplots showing the total number of molecules detected versus the number of genes detected before and after the filtrations (top). Additional set of scatterplots showing the total number of molecules detected versus the percentage of mitochondrial genes before and after the filtrations (bottom).
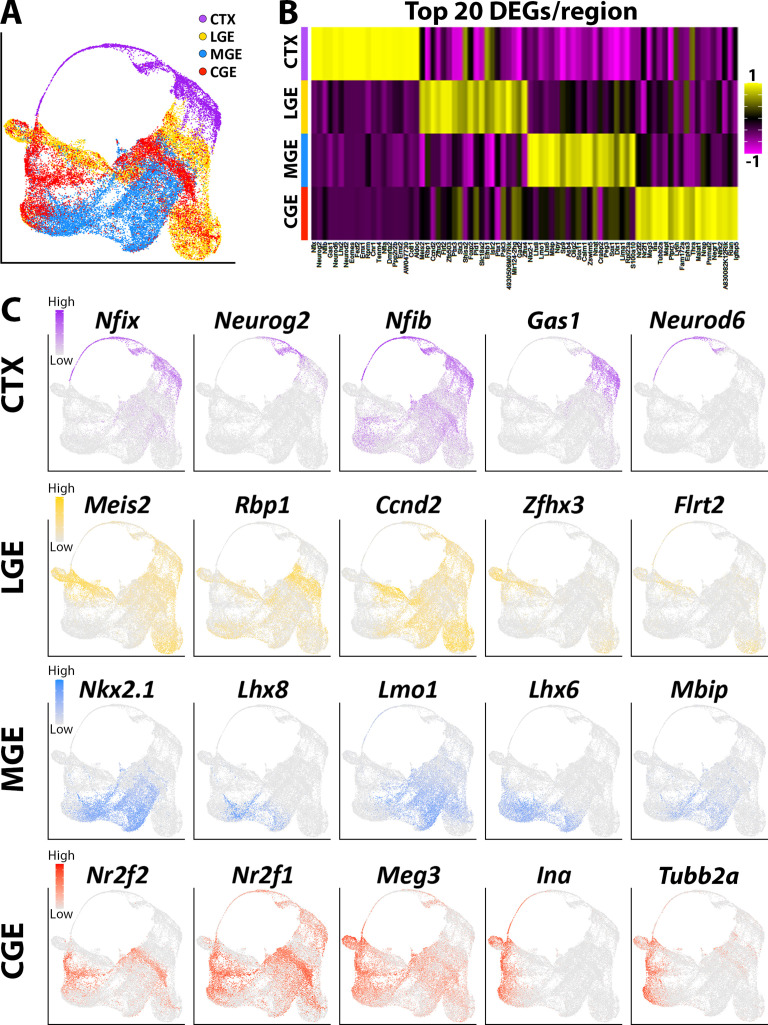
Figure 1—figure supplement 3. Identification of region-specific genes from each telencephalic region at E12.5.

Figure 1—figure supplement 3.

(A) UMAP plot of all cells annotated by brain region. (B) Heatmap showing expression of top 20 differentially expressed genes (DEGs) in each region. Each column represents averaged expression in cells, color-coded as per the color scale. (C) UMAP plots depicting the top 5 DEGs from each region. Cells are color-coded for levels of gene expression as per the color scales.