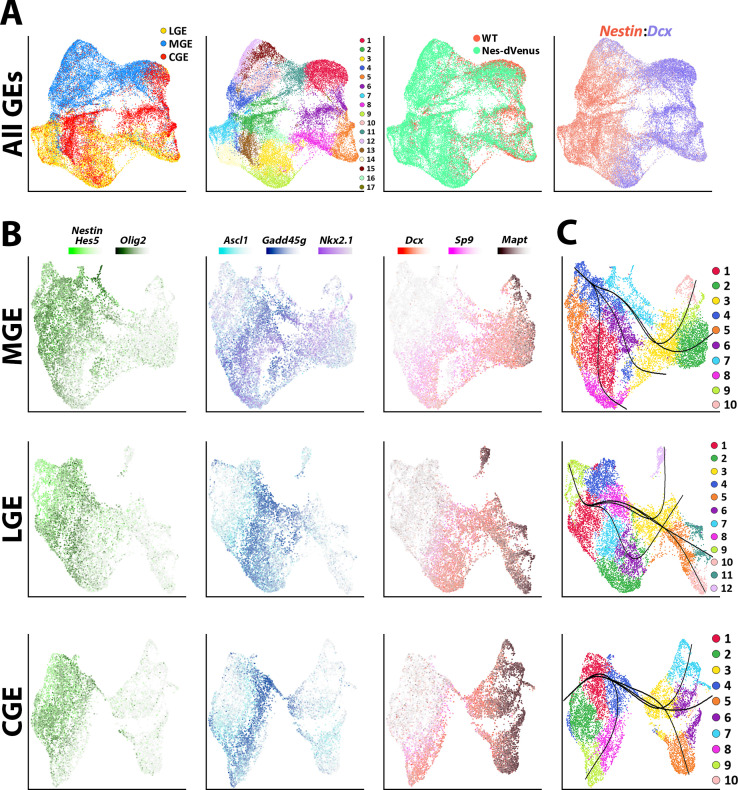
Figure 2. Common neurogenic lineages in each ganglionic eminence.
(A) UMAP plots displaying all GE-derived cells annotated from left to right by: brain region, putative cell clusters, mouse strain and expression of VZ marker Nestin and SVZ/MZ marker Dcx. (B) UMAP visualizations show transcriptional diversity in each GE region. Several genes are depicted to highlight distinct neurogenic stages: Nestin, Hes5, and Olig2 are indicative of VZ cells (green), Asc1 and Gadd45g label intermediate SVZ cells (blue), and Dcx, Sp9, and Mapt depict postmitotic neuronal precursors (red). (C) UMAP plots of MGE, LGE, and CGE cells annotated via putative cell clusters and including Slingshot analyses depicting developmental progression through neurogenic stages.


