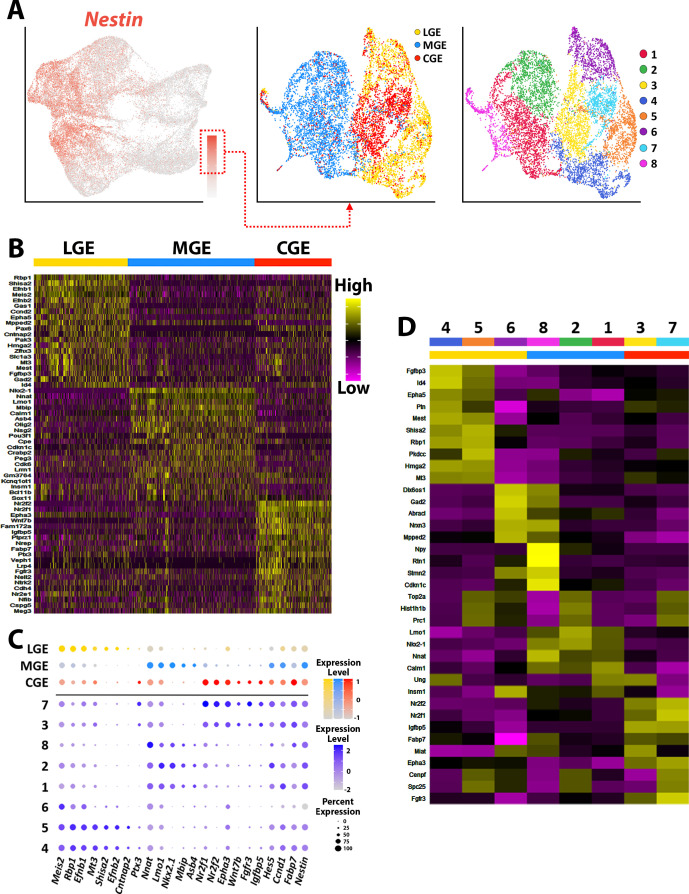
Figure 4. Transcriptional heterogeneity of Nestin-expressing VZ cells in the ganglionic eminences.
(A) High Nestin-expressing (> 1.5 normalized dataset) cells were extracted from GE dataset and replotted as UMAP graphs annotated by brain region and putative cell clusters. (B) Heatmap of top 20 DEGs enriched in VZ cells from the LGE, MGE, and CGE. Each column represents expression in a single cell, color-coded as per the color scale. (C) Dot-plot depicting expression levels of DEGs within each brain region (LGE, MGE, and CGE) and cell cluster. (D) Heatmap showing expression of top 5 DEGs in each cluster from (A), with colored bar depicting whether each cluster contains cells from the LGE (yellow), MGE (blue), or CGE (red). Gray bar indicates cluster containing cells from all three GEs. Each column represents averaged expression in cells, color-coded as per the color scale.


