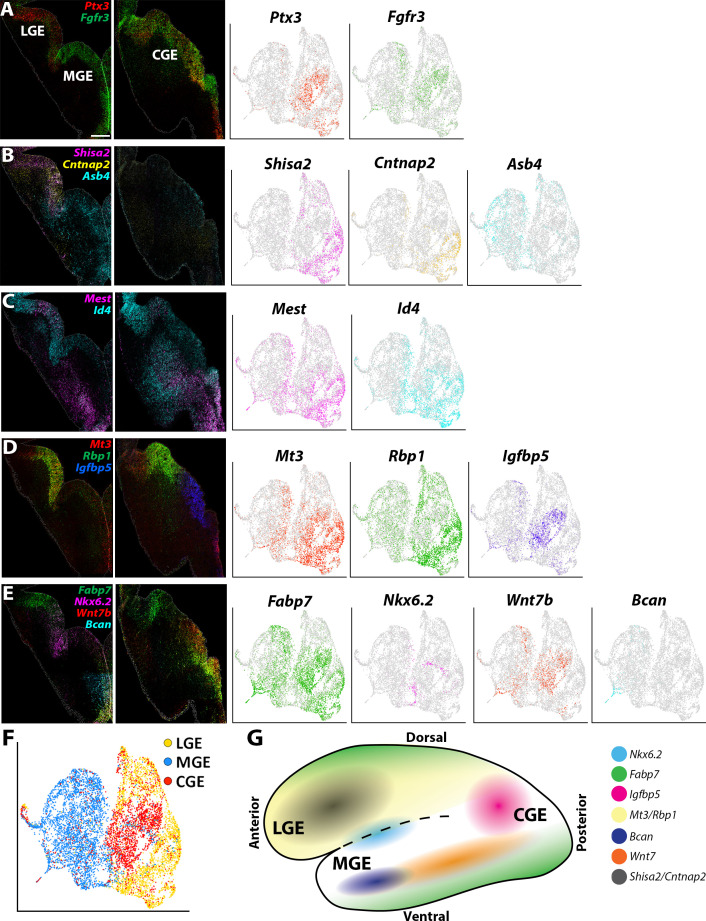
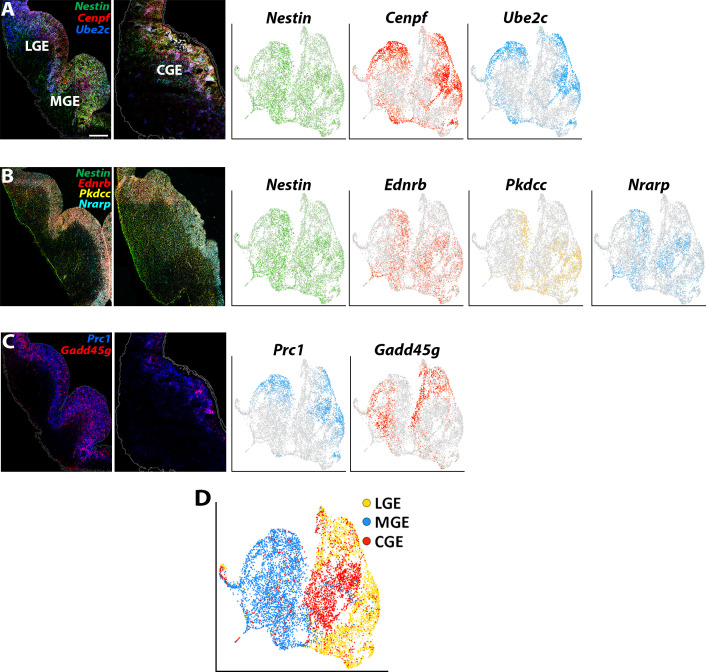
Figure 5. Expression profiles of spatially-enriched genes in VZ cells in the ganglionic eminences.
(A–E) Left, RNAscope HiPlex and HiPlexUp in situ hybridization assays of differentially expressed VZ genes on E12.5 GE coronal sections. Right, the corresponding UMAP plots of VZ-enriched genes depicted in the in situs. Scale bar in A = 200 μm. (F) UMAP plot of Nes-enriched cells annotated by brain region. (G) Schematic of a whole mount view of the E12.5 ventral telencephalon depicting the approximate spatial location of VZ-enriched genes within the GEs.


