. 2022 Feb 17;11:e71864. doi: 10.7554/eLife.71864

Figure 6. Expression profiles of spatially-enriched genes in SVZ/MZ cells in the ganglionic eminences.

(A–E) Left, RNAscope HiPlex and HiPlexUp in situ hybridization assays of differentially expressed SVZ/MZ genes on E12.5 GE coronal sections. Right, the corresponding UMAP plots of SVZ/MZ-enriched genes depicted in the in situs. Scale bar in A = 200 μm. (F) UMAP plot of Dcx-enriched cells annotated by brain region. (G) Schematic of a coronal section through the E12.5 ventral telencephalon depicting the approximate spatial location of SVZ/MZ-enriched genes within the GEs.

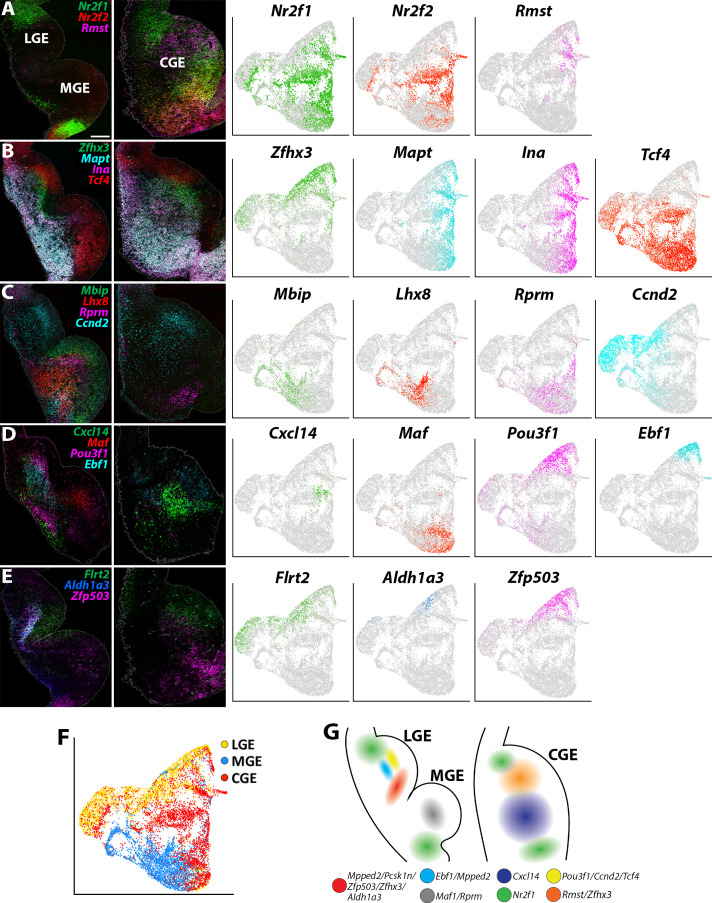
Figure 6.

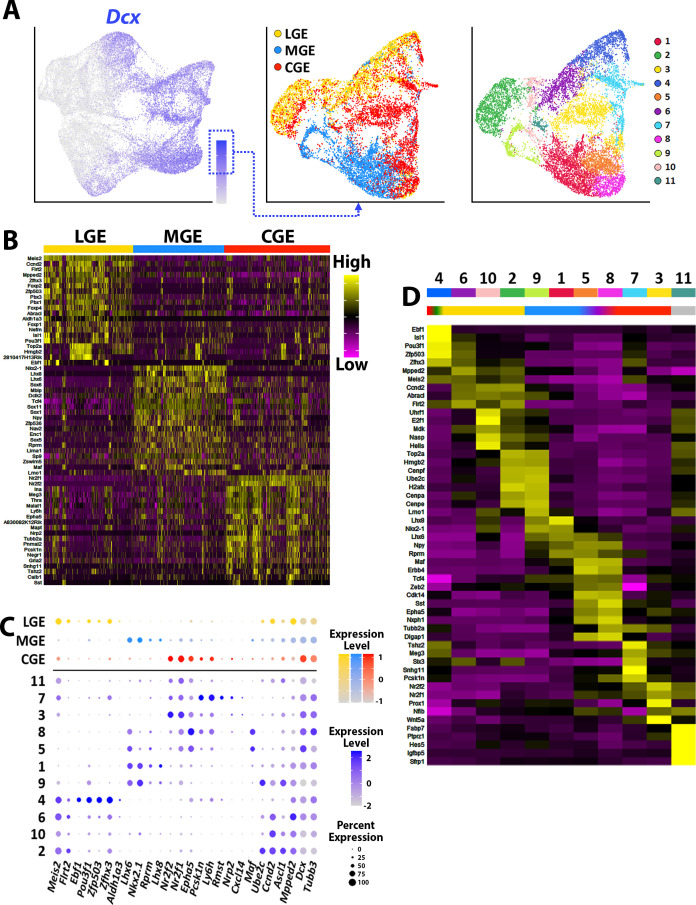
Figure 6—figure supplement 1. Characterization of genes enriched in high Dcx-expressing cells.

Figure 6—figure supplement 1.

(A) High Dcx-expressing cells (> 1.5 normalized dataset) were extracted from the full GE dataset and replotted, annotated by brain region (middle) and putative cell clusters (right). (B) Heatmap of top 20 SVZ/MZ-enriched genes showing differential expression between LGE, MGE, and CGE. Each column represents expression in a single cell, color-coded as per the color scale. (C) Dot-plot depicting expression levels of SVZ/MZ-enriched DEGs within each brain region (LGE, MGE, and CGE) and cell cluster. (D) Heatmap showing expression of top 5 DEGs in each cluster from (A), with colored bar depicting whether each cluster contains cells from the LGE (yellow), MGE (blue), or CGE (red). Each column represents averaged expression in cells, color-coded as per the color scale.
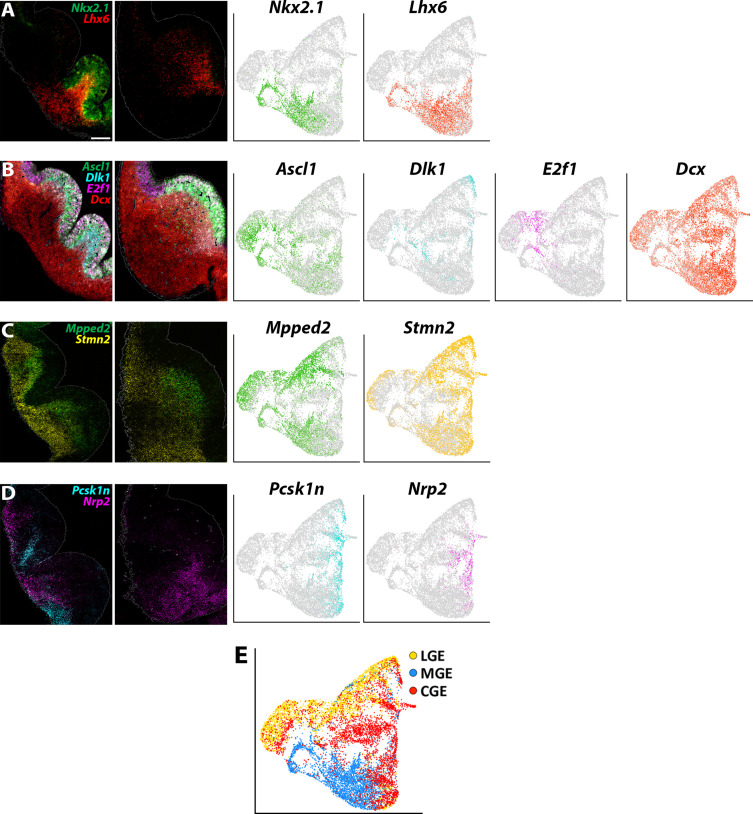
Figure 6—figure supplement 2. Expression profiles of additional SVZ/MZ-enriched genes in the ganglionic eminences.

Figure 6—figure supplement 2.

(A–D) Left, RNAscope HiPlex and HiPlexUp in situ hybridization assays of SVZ/MZ-enriched genes on E12.5 GE coronal sections. Right, the corresponding UMAP plots of SVZ/MZ-enriched genes depicted in the in situs. Scale bar in A = 200 μm. (E) UMAP plot of Dcx-enriched cells annotated by brain region.