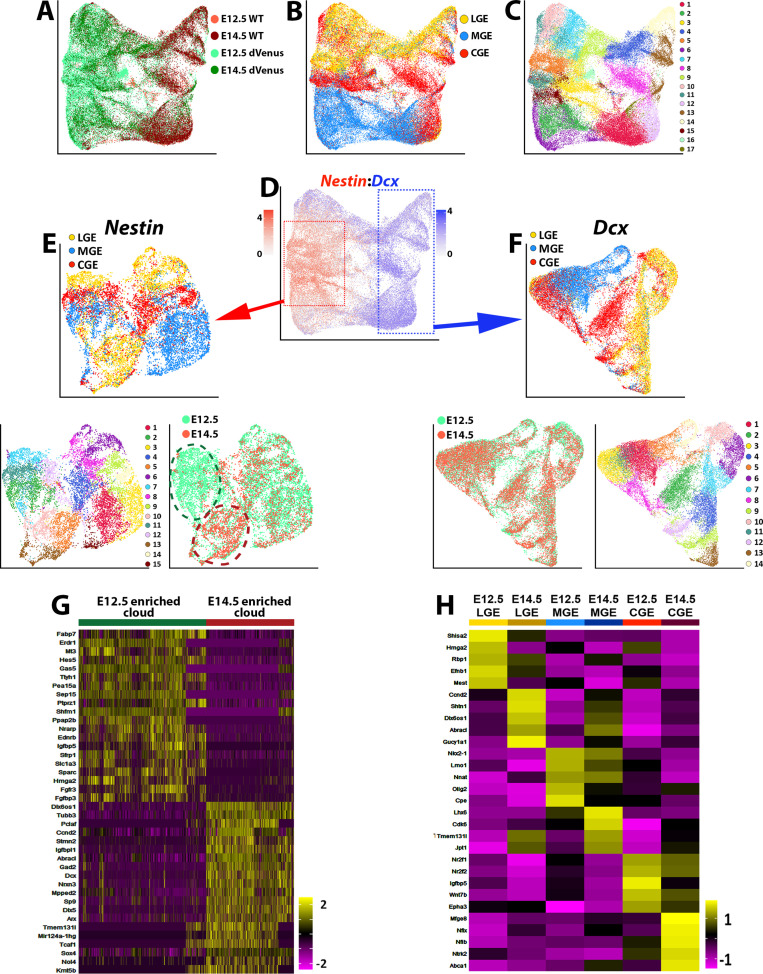
Figure 7. Comparison of transcriptional changes between E12.5 and E14.5 ventral telencephalon.
(A–C) UMAP plots of all E12.5 and E14.5 cells annotated by mouse line and embryonic timepoint (A), brain region (B), and putative cell clusters (C). (D) UMAP plot of E12.5 and E14.5 cells depicting expression levels of Nestin and Dcx. Red box = approximate location of high Nestin-expressing cells (> 1.5 normalized dataset), blue box = approximate location of high Dcx-expressing cells (> 1.5 normalized dataset). (E) UMAP plot depicting high Nestin-expressing cells annotated by brain region (top), putative cell clusters (lower left) and timepoint (lower right). Note the clouds that are strongly enriched for E12.5 cells (dark green oval) and E14.5 cells (dark red oval). (F) UMAP plot depicting high Dcx-expressing cells annotated by brain region (top), putative cell clusters (lower right) and timepoint (lower left). Note that E12.5 and E14.5 cells are largely overlapping populations with no clear differential clustering. (G) Heatmap depicting the top 20 DEGs between the E12.5-enriched (dark green oval) and E14.5-enriched (dark red oval) clouds of VZ cells from (E). The E14.5-derived cells were removed from the E12.5-enriched cloud, and vice versa. Each column represents expression in a single cell, color-coded as per the color scale. (H) Heatmap depicting the top 5 DEGs in VZ cells from each GE region at E12.5 and E14.5. Each column represents averaged expression in cells, color-coded as per the color scale.


